Storage Mechanics
Salt caverns, depleted reservoirs, LNG peak shavers, working gas vs base gas, and the seasonal cycle of injections and withdrawals.
On Fri Oct 23, 2015, residents of Porter Ranch, a master-planned community of roughly 12,000 homes in the northwest corner of the San Fernando Valley in Los Angeles County, began calling Southern California Gas Company to report a strong odor of mercaptan, the sulfur-based odorant added to natural gas to make leaks detectable. The smell was coming from the Santa Susana Mountains above the neighborhood. SoCal Gas crews dispatched to the Aliso Canyon underground storage field, a former Tidewater Oil Company reservoir converted to gas storage in 1971, identified well SS-25 as the source. SS-25 was an injection well drilled in 1953 for the field’s prior life as an oil reservoir. The casing had failed roughly 500 feet below the surface, releasing methane to the atmosphere at a rate eventually measured at over 50,000 kilograms per hour at peak.
The leak ran 112 days. SoCal Gas attempted seven surface kill operations through November and December 2015. Each was defeated by the well’s high-rate flow, which prevented heavy kill mud from settling against the leak source. A relief well drilled from a separate surface location intersected SS-25 in the deep salt and cement programs in early February 2016 and allowed kill mud to be pumped into the original wellbore from below. On Thu Feb 11, 2016, SoCal Gas declared the well permanently sealed. Roughly 100,000 metric tons of methane had vented to the atmosphere, the largest reported gas leak in US history. Over 8,000 households were temporarily displaced from Porter Ranch.
The chapter that follows is the geology, the engineering, the regulation, and the market structure of US gas storage, the system to which Aliso Canyon belonged.
The Four Storage Types
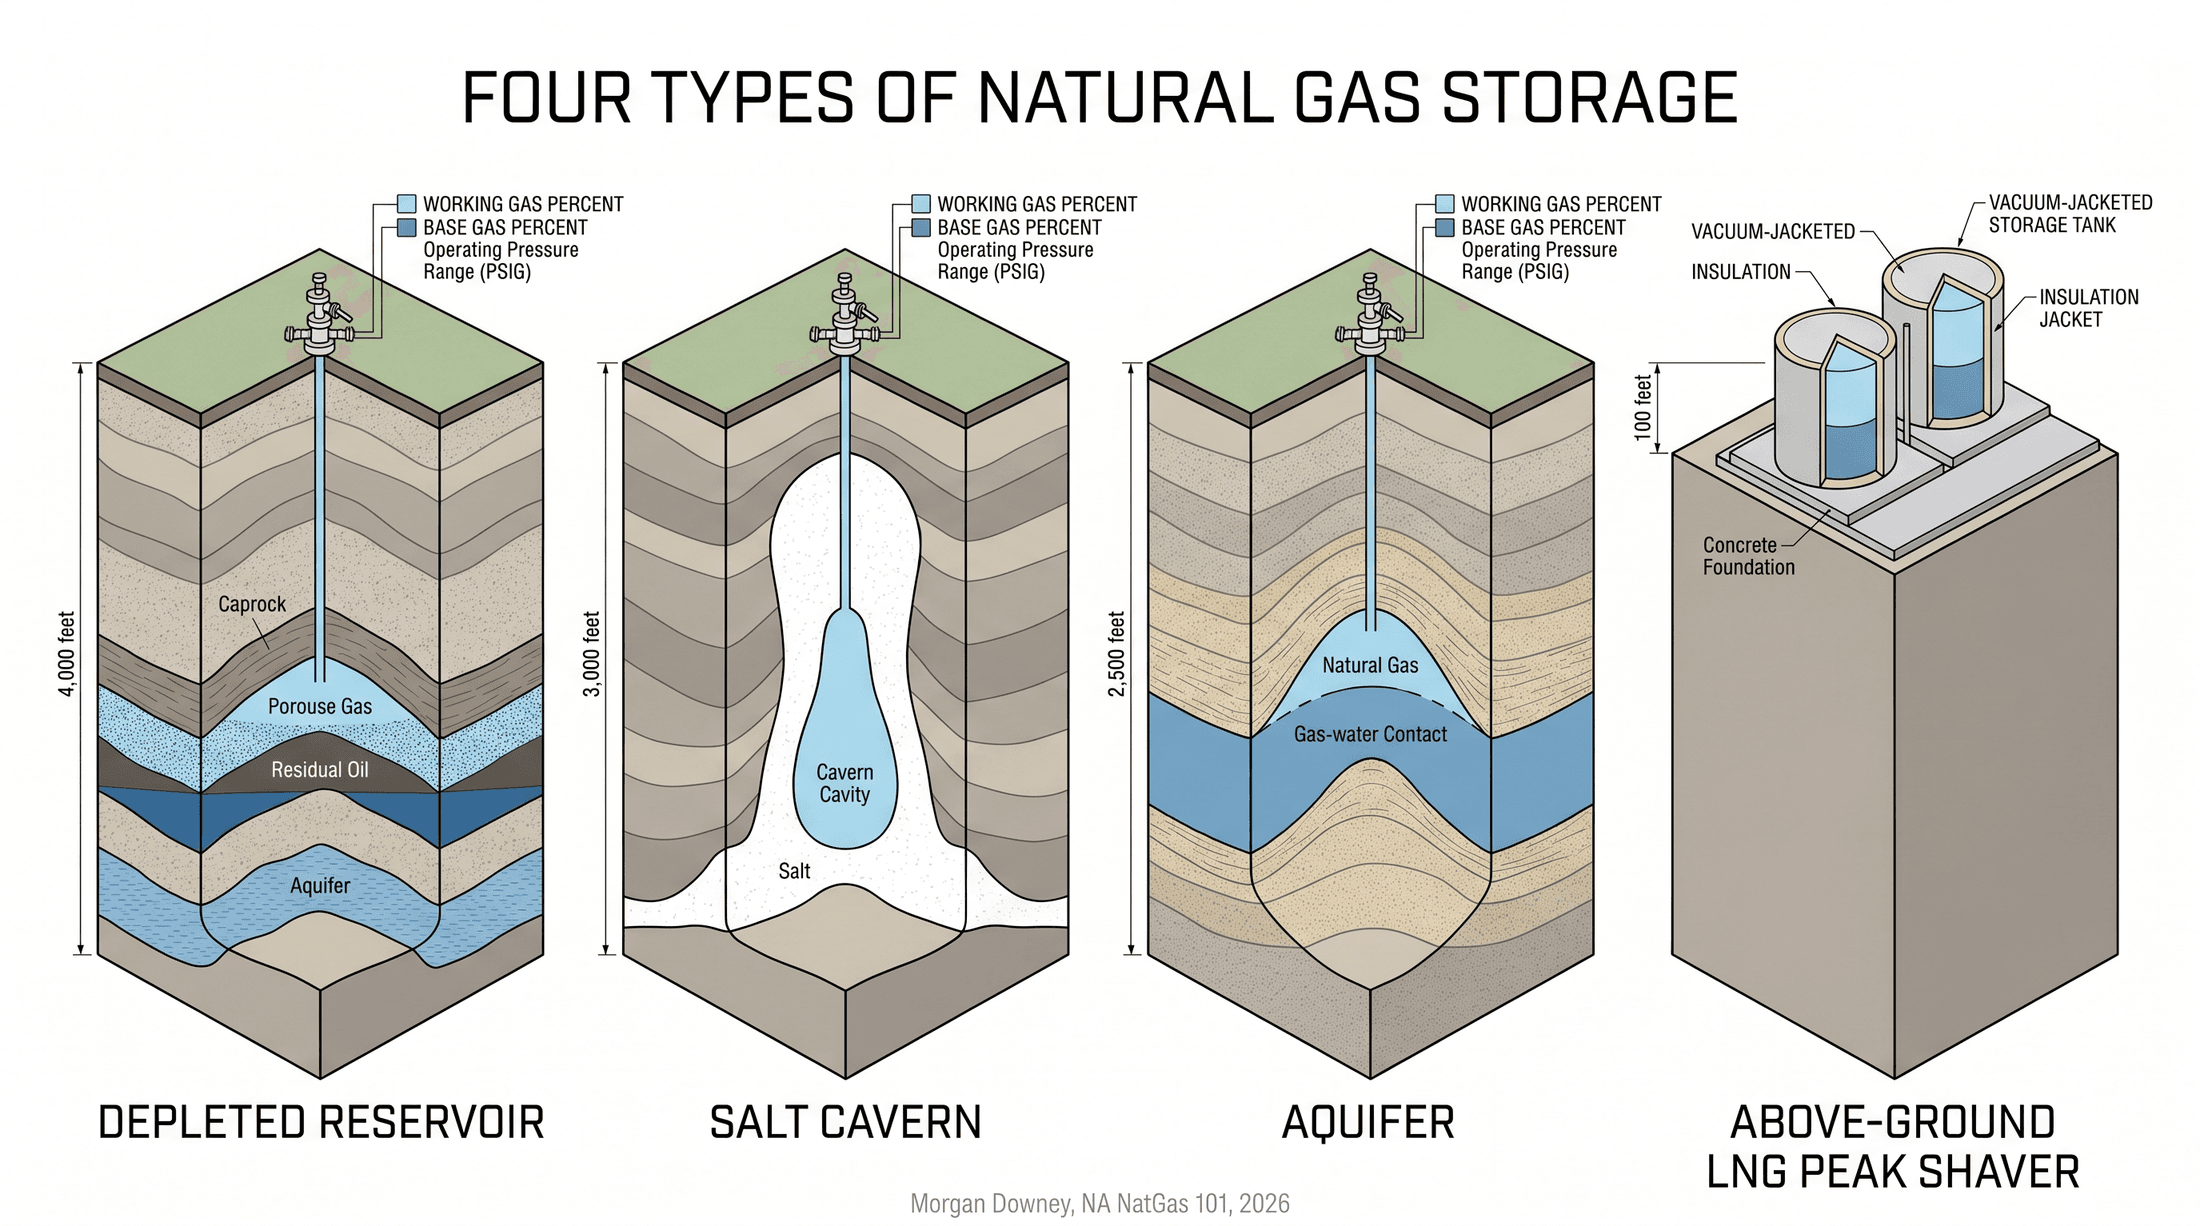
The US holds roughly 4.7 trillion cubic feet of working gas storage capacity in approximately 400 underground facilities, supplemented by a small number of above-ground LNG peak-shaving tanks held by Northeast and Mid-Atlantic local distribution companies. Four physical types account for the entire underground inventory.
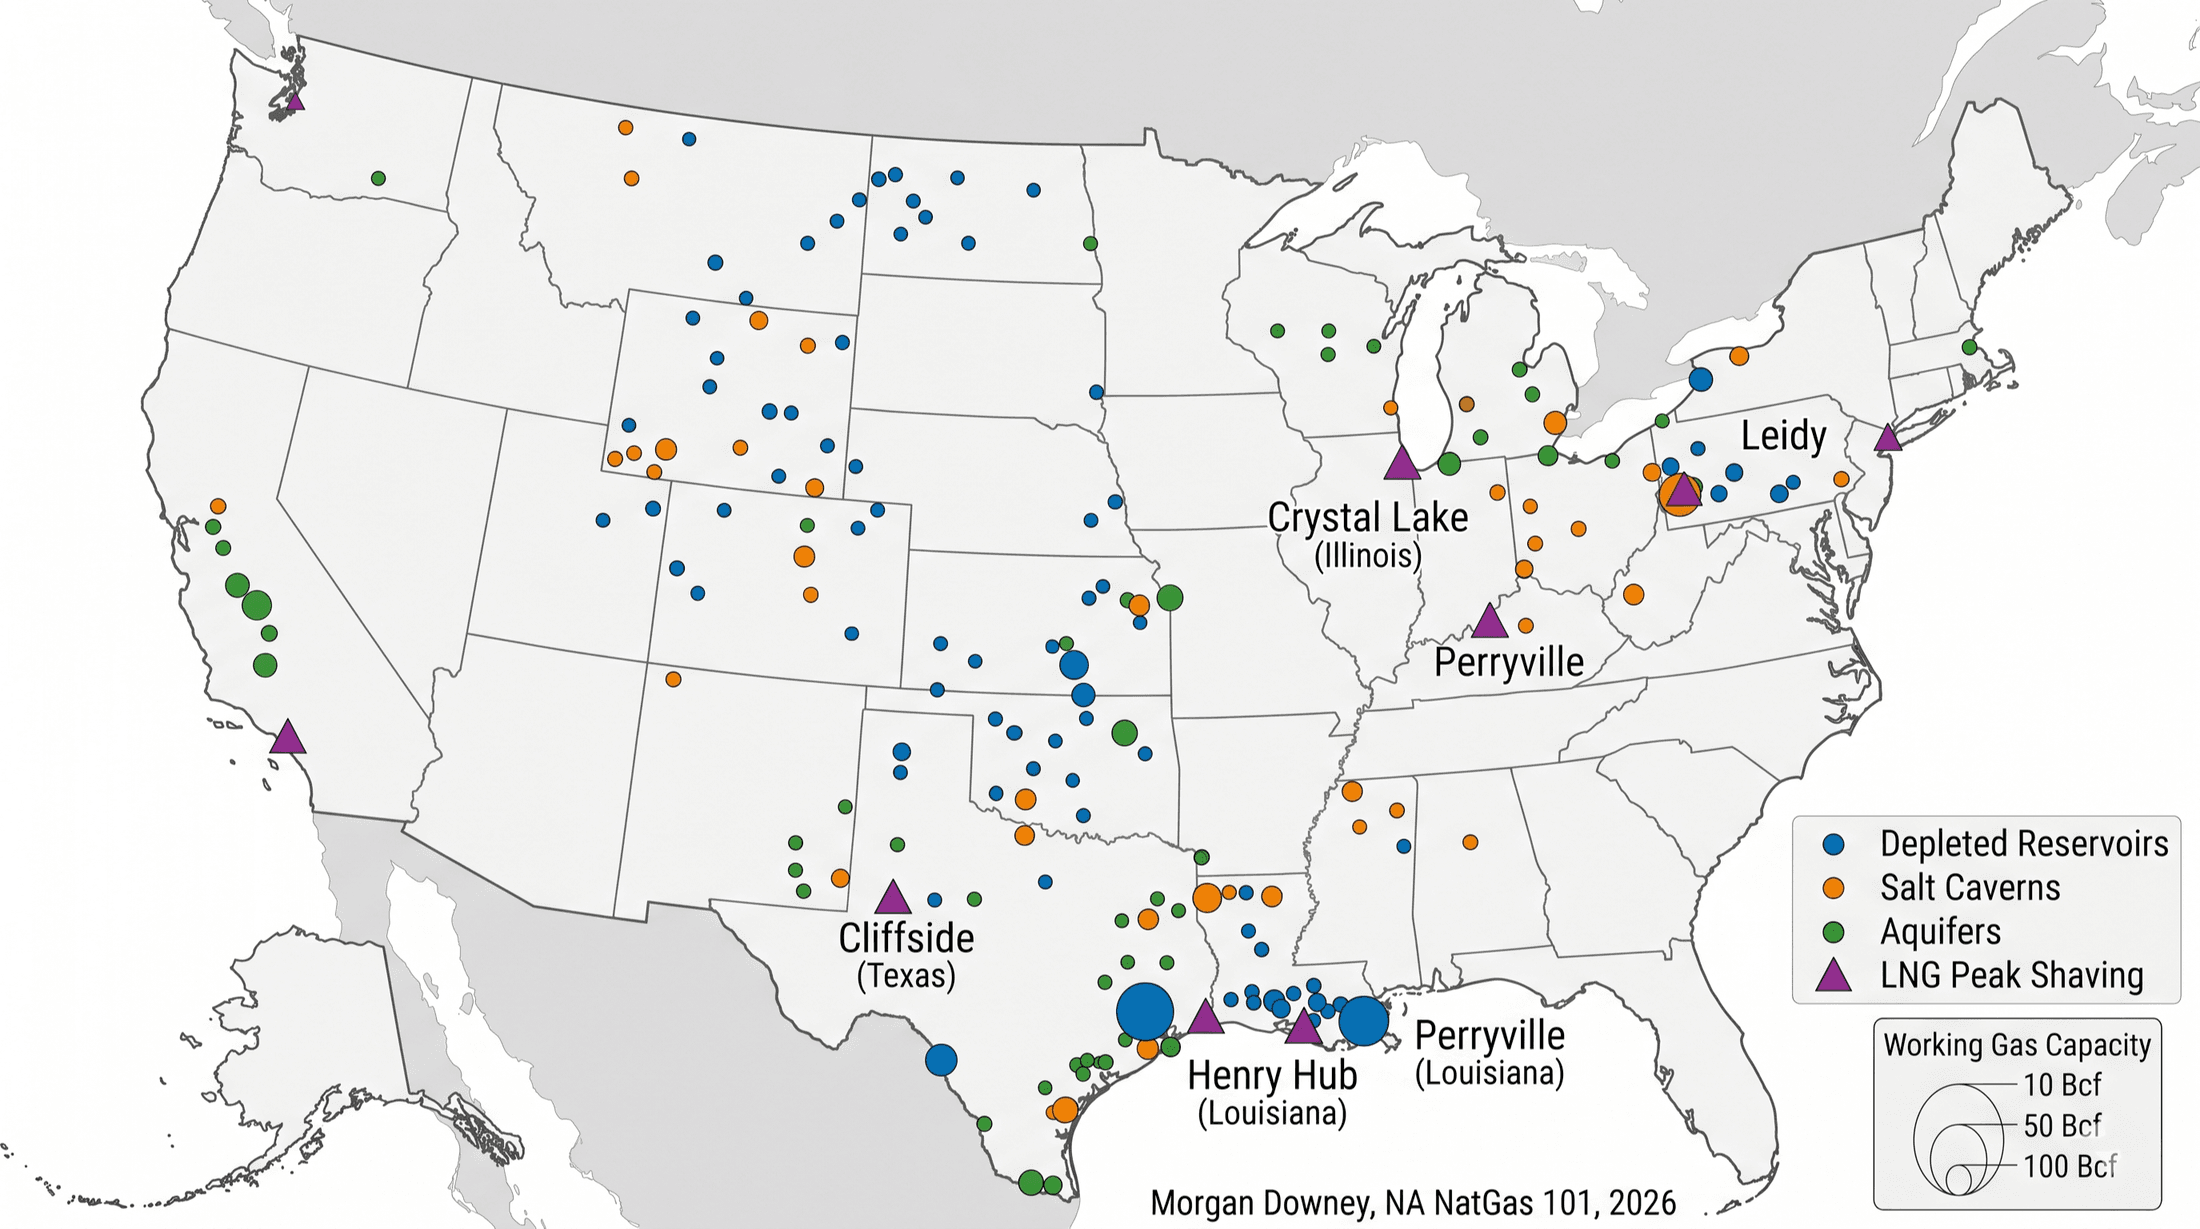
Depleted oil and gas reservoirs are the largest type by working gas volume, accounting for roughly 80 percent of US storage capacity. The mechanism is straightforward. A formerly producing reservoir, drilled and depleted decades earlier, has porosity and permeability that once held hydrocarbons and a structural or stratigraphic trap that retained them. The overlying caprock that sealed the reservoir for hundreds of millions of years still seals it. Working gas is injected through repurposed wellbores during the summer, displacing residual hydrocarbons and any aquifer water that has imbibed back into the pore space. Withdrawal in winter reverses the flow. The legacy oil fields of western Pennsylvania and West Virginia, the Niagaran reef play of Michigan, the legacy gas fields of Oklahoma and Kansas, and the Frio sands of the Texas Gulf Coast all host major depleted-reservoir storage. Cycling rates are low: a typical depleted reservoir storage facility turns its working gas inventory 1 to 1.5 times per year, with summer injection from April through October and winter withdrawal from November through March.
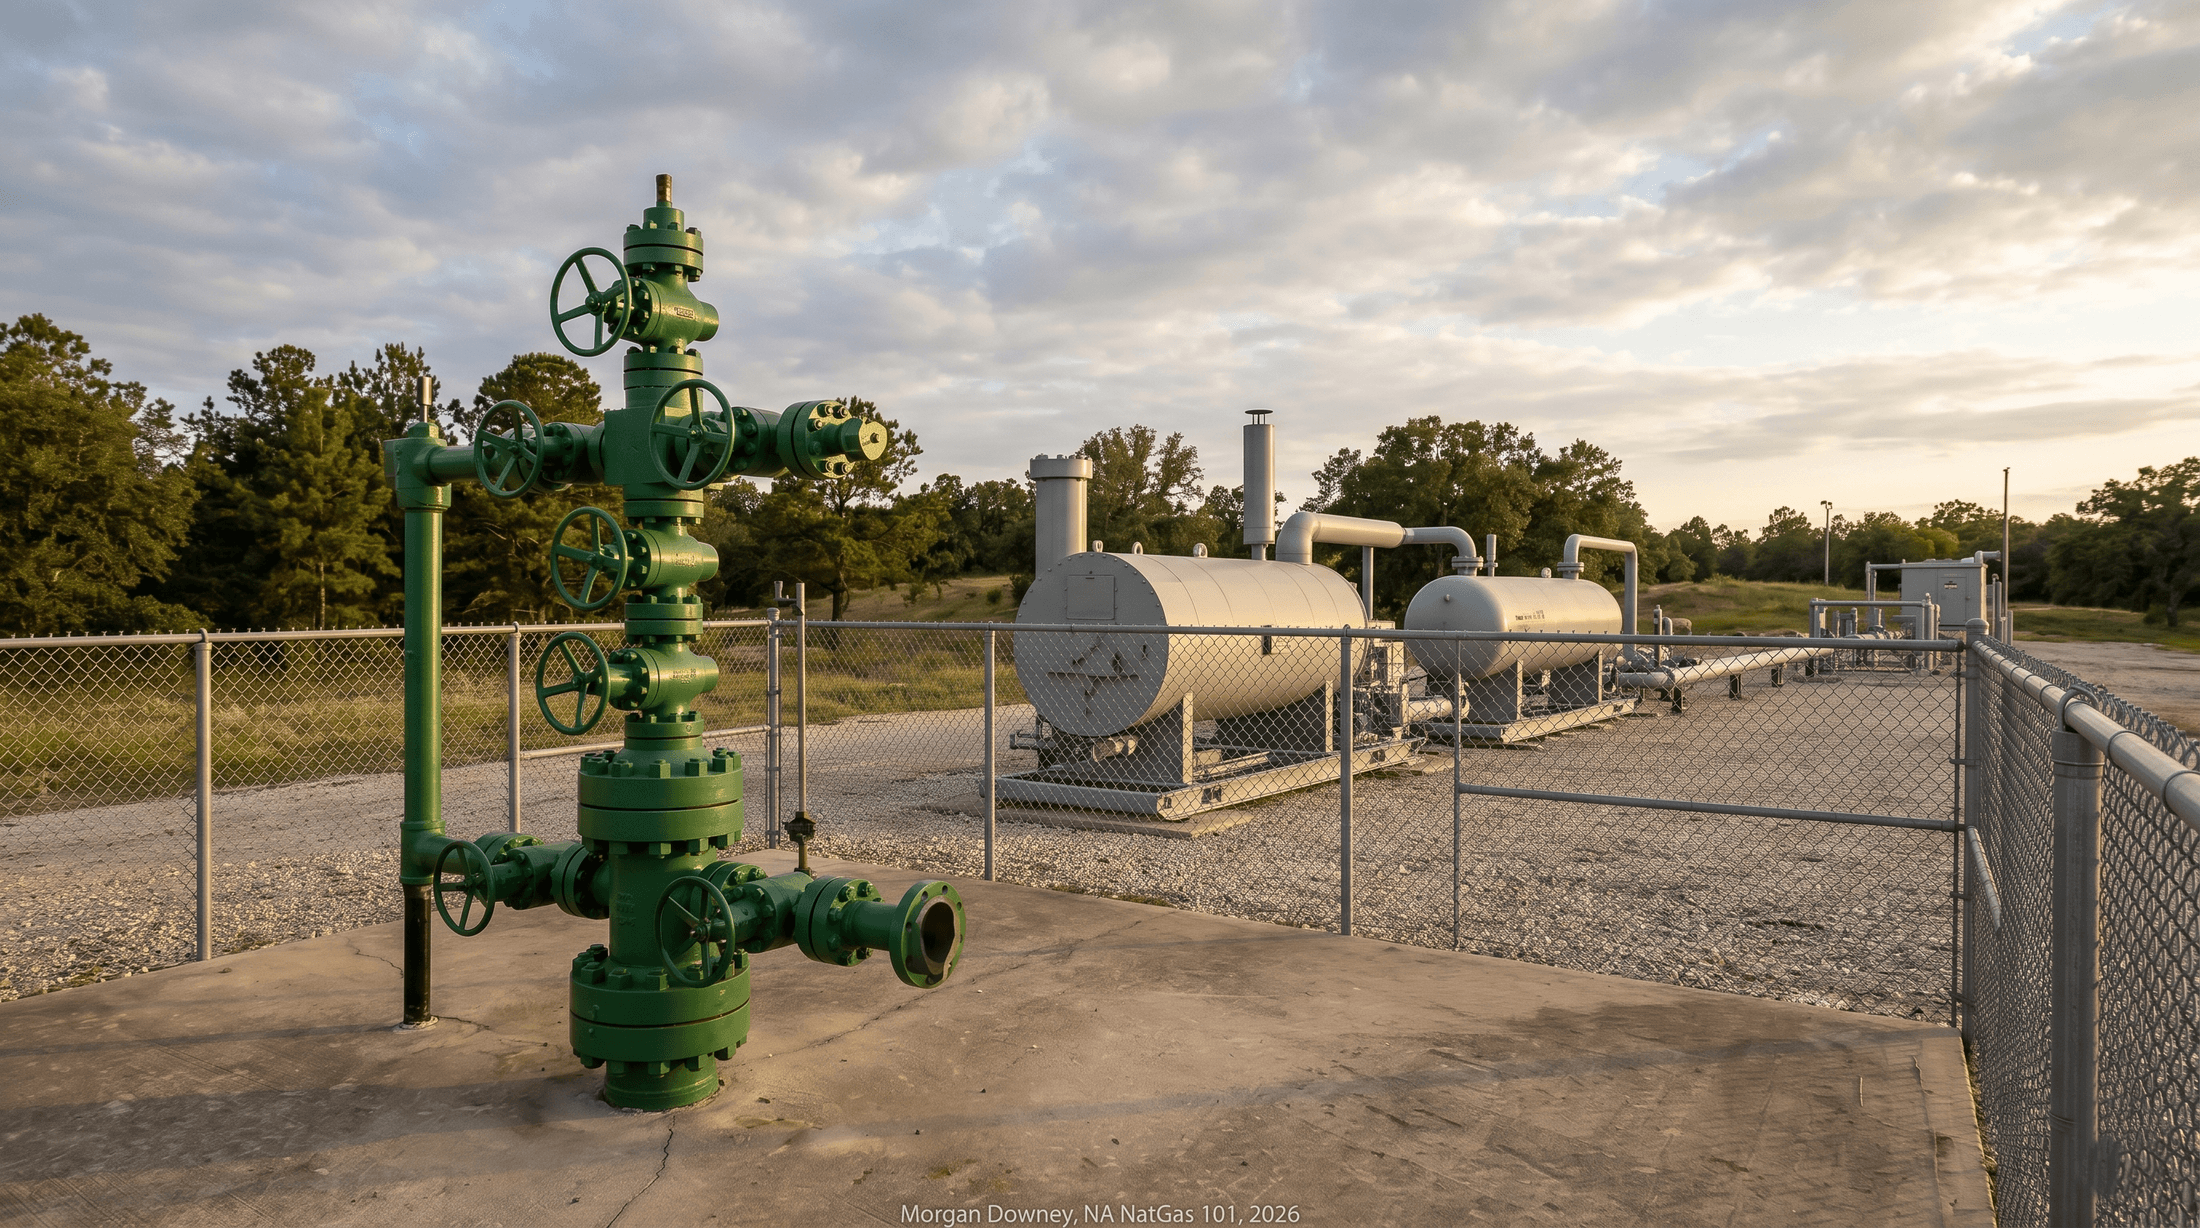
Salt caverns are the second category and provide the highest deliverability per unit of working gas. A cavern is leached out of bedded salt or salt-dome formations by fresh-water injection over 12 to 24 months. The resulting cavity, typically pear-shaped or cylindrical at depths of 2,500 to 4,500 feet, is sealed on all sides by impermeable salt and overlain by impermeable caprock. Salt is uniquely suited to gas storage because it is impermeable to gas at storage pressures, behaves plastically (small fractures self-seal under cavern pressure), and can be shaped to specification by controlled water-leaching. A typical Gulf Coast storage cavern holds 5 to 15 Bcf of working gas and can deliver 100 to 300 MMcf/d through a single wellbore. Cycling rates are 5 to 12 turns per year. The Gulf Coast salt-dome belt running from southeast Texas through Louisiana to Mississippi (Egan, Magnolia, Bobcat, Pine Prairie, Moss Bluff) holds the majority of US salt cavern storage. The Northeast Onondaga and Salina bedded-salt formations in southern New York, Pennsylvania, and West Virginia (Stagecoach, Steckman Ridge) host bedded-salt storage with smaller per-cavern volumes than the dome storage but with similar high-cycle operational characteristics.
Aquifer storage works on the same physical principle as depleted reservoir storage but uses a water-bearing porous formation instead of a depleted hydrocarbon reservoir. Gas is injected against the resident water under pressure, displacing the water laterally and creating a gas bubble at the structural high. The category is concentrated in the Midwest where suitable depleted reservoirs are scarce. The Crystal Lake and Lake Bloomington fields in northern Illinois (Southern Company Gas, the parent of the former Nicor Gas) and the Manlove Field in central Illinois are the canonical US aquifer storage operations. Aquifer storage is operationally more complex than depleted reservoir storage because the pressure pulse propagates through a continuous water column, the gas bubble’s geometry is harder to characterize, and the formation pressure response to injection and withdrawal is more variable.
Above-ground LNG peak-shaving is the smallest category by volume and the most operationally distinct. A peak-shaving plant houses one or more vacuum-jacketed cryogenic tanks, each typically 1 to 4 Bcf of LNG capacity, supplied by an on-site liquefier that runs continuously at a small fraction of the plant’s vaporization rate. The plant liquefies gas slowly through the year and vaporizes it rapidly on the coldest winter days for delivery into the local distribution network. New England, the Mid-Atlantic, and a handful of upstate New York LDCs hold most of the US peak-shaving capacity, which has historically substituted for the underground storage that the dense glacial geology of the region cannot provide. The mechanics are not the mechanics of the underground system. The role is.
Working Gas, Base Gas, and the Deliverability Curve
Every underground storage facility holds gas in two accounting categories. Working gas is the volume that cycles in and out each season, the figure the EIA reports each Thursday. Base gas, sometimes called cushion gas, is the volume that must remain in the reservoir or cavern at all times to maintain the pressure required to deliver working gas through the withdrawal season at contractually specified flow rates. The split between the two is a function of the storage type, the formation depth, and the engineering design.
Depleted reservoir storage typically holds base gas at 30 to 50 percent of total gas in place. A 100 Bcf working-gas facility may hold 50 to 100 Bcf of base gas behind it, for a total reservoir gas inventory of 150 to 200 Bcf. Salt caverns, with their higher operating pressures and tighter geometric containment, hold base gas at 20 to 30 percent of total. A 10 Bcf working-gas cavern may hold only 3 to 4 Bcf of base gas. Aquifer storage, with its greater pressure-management complexity, typically requires 50 to 80 percent base gas. The base gas is real inventory: it was bought, it was injected, it sits in the formation, and it is on the operator’s balance sheet as an asset. It is not commercially available.
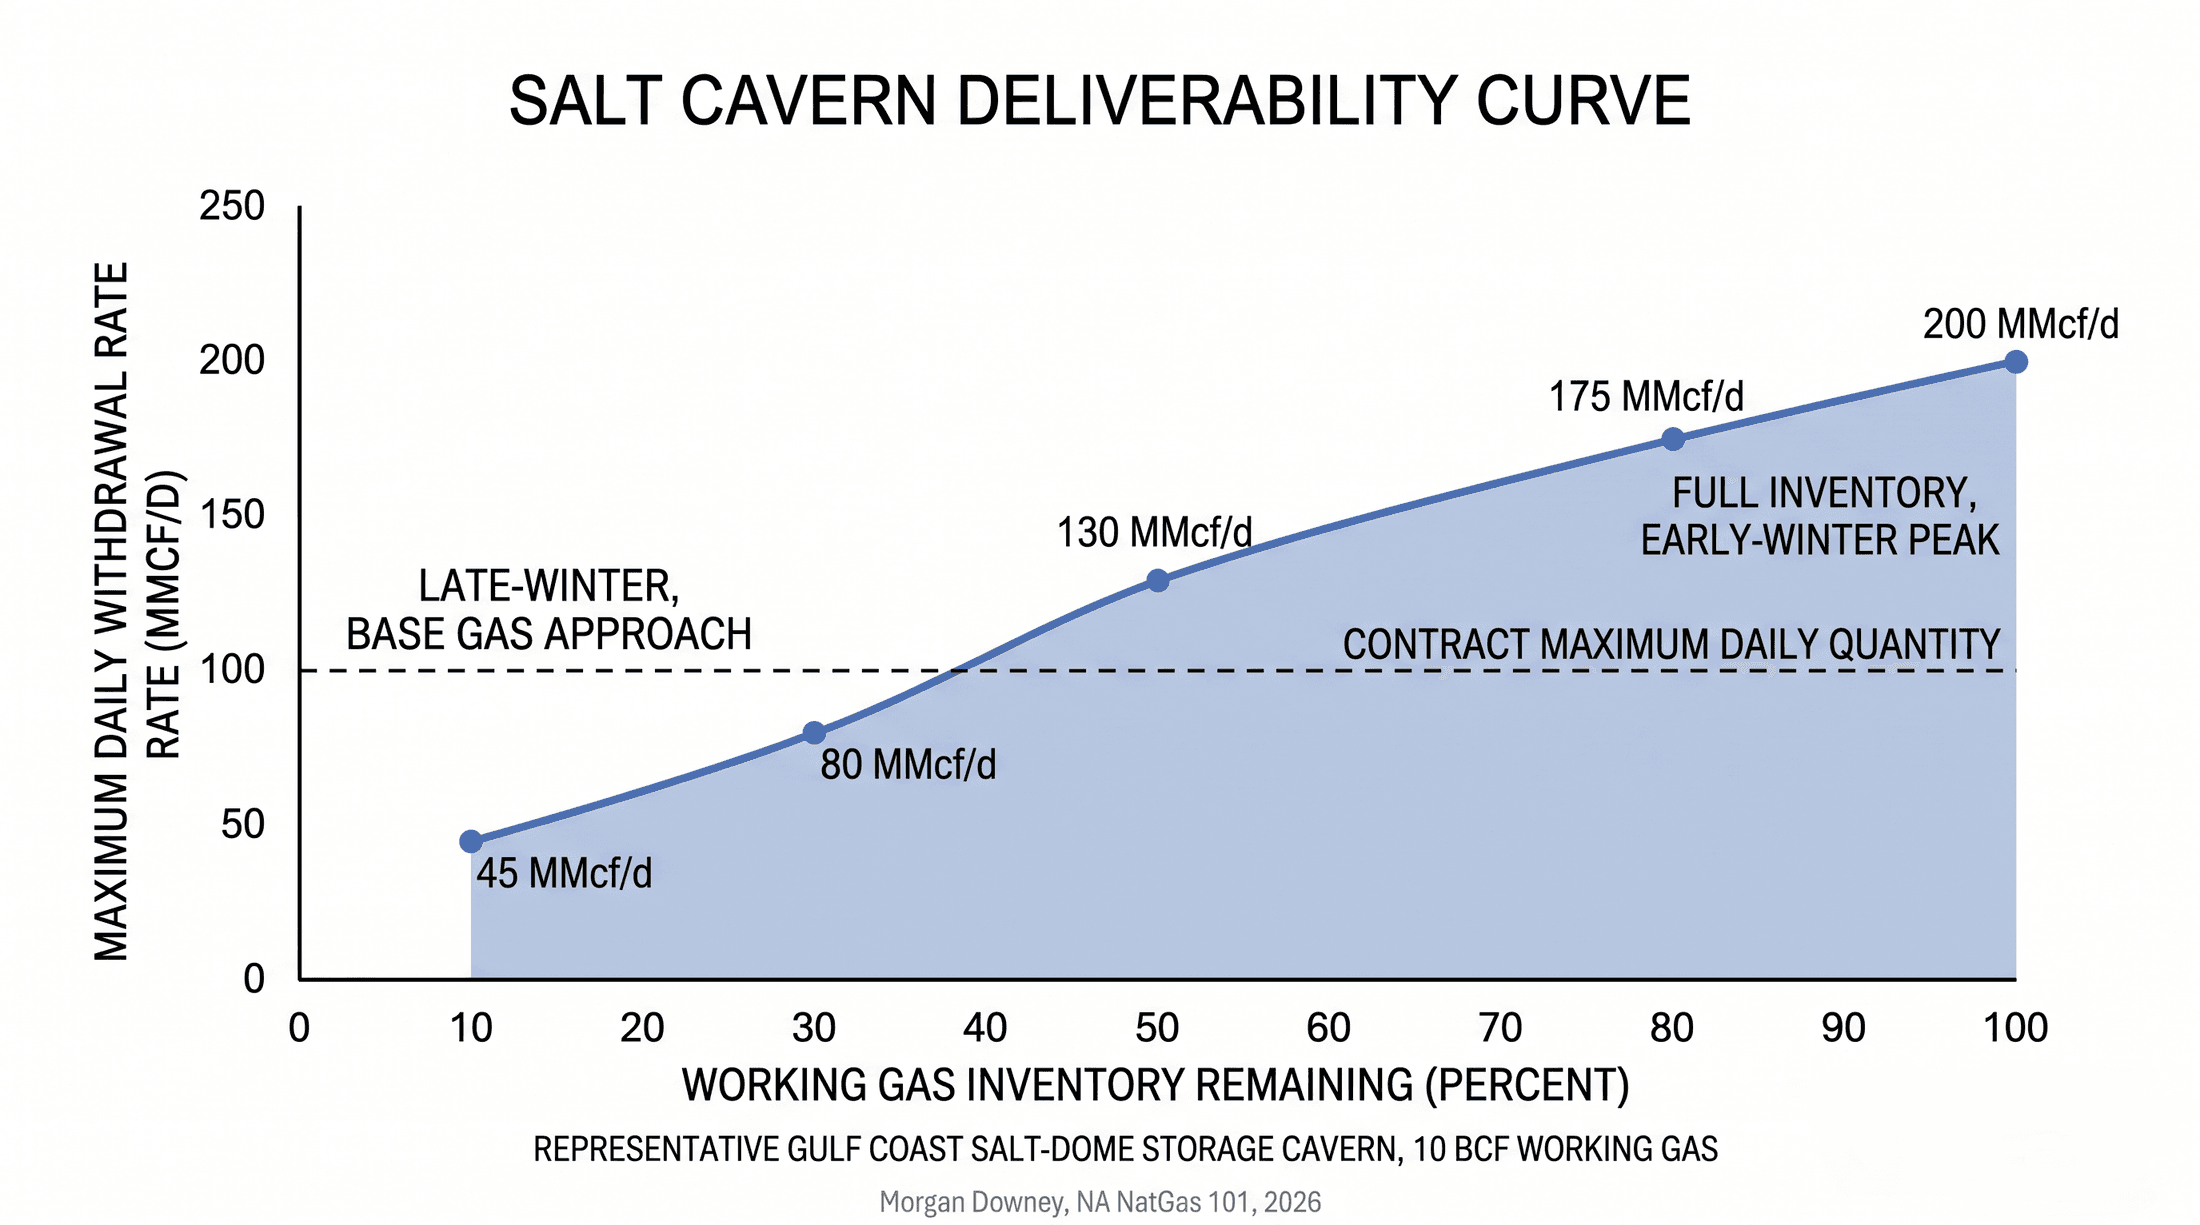
The deliverability curve, sometimes called the discharge curve or the pressure-driven delivery profile, describes how the maximum withdrawal rate from a facility declines as working gas is depleted. The physics are pressure-driven. Gas in the reservoir or cavern is at a pressure determined by the volume of gas in place divided by the available pore or cavity volume, multiplied by the gas compressibility factor at reservoir temperature. As working gas is withdrawn, the pressure declines. The pressure differential between the reservoir and the wellhead drives the flow rate. The curve is therefore monotonically declining: the more working gas a facility has delivered, the lower the maximum rate at which it can deliver the next day’s gas.
A representative salt cavern at full working gas inventory might deliver 200 MMcf/d through a single well. At 50 percent working gas remaining, the same cavern delivers roughly 130 MMcf/d. At 30 percent remaining, the rate drops to roughly 80 MMcf/d. At 10 percent remaining, the cavern’s pressure approaches base gas pressure and the rate falls below 50 MMcf/d. Depleted reservoirs decline more steeply through the late-winter drawdown, particularly in February and early March when working gas inventories are at their lowest. The deliverability curve is what makes a December peak day stress test different from a January peak day, and a January peak day different from a March peak day.
The operational consequence is that the storage industry plans for the worst case. A 5,000 MMcf/d firm-storage commitment must be deliverable on Thu Feb 27, 2014 (the late-winter peak day during the polar vortex), not on Thu Dec 18, 2014 (the early-winter peak day) when working gas is at its seasonal high and reservoir pressures are at their seasonal high. Storage tariffs accordingly specify a contract Maximum Daily Quantity that can be delivered at the operator’s specified seasonal pattern of working gas inventory, not at full inventory. Firm storage shippers pay for the assurance that the pipe at the back of the cavern will deliver gas on the day it is needed, even after months of withdrawal. The tariff is the contractual expression of the deliverability curve.
Salt Cavern Leaching and Operation
A salt cavern is a manufactured cavity. The construction sequence is engineered, slow, and irreversible. Once the salt is dissolved, it does not regenerate.
The process begins with site characterization. Salt domes (large, irregular, vertically extensive bodies of salt that have risen through overlying sediments by buoyancy over millions of years) and bedded salt formations (horizontal layers of salt deposited in evaporite basins) are mapped from seismic surveys, well logs, and historical drilling records. The Gulf Coast salt domes of southeast Texas, Louisiana, and Mississippi are the largest US storage host. They originate from the Jurassic Louann Salt that underlies the entire Gulf of Mexico basin and that has piercement-domed upward through the overlying sediments along structural weaknesses. The Onondaga and Salina bedded-salt formations of the Northeast were deposited in shallow Silurian seas roughly 420 million years ago and lie in continuous, gently dipping layers beneath central New York, northern Pennsylvania, and northern West Virginia.
Construction begins with a single vertical wellbore drilled from the surface to the salt roof, typically 1,500 to 4,500 feet below grade depending on the formation. Surface casing is set above the salt; an intermediate casing is set into the salt roof and cemented in place to seal the wellbore from any overlying or underlying aquifer or porous formation. A pair of concentric tubing strings is then run inside the casing: the outer (annular) string injects fresh water, the inner string returns the resulting brine to the surface. Fresh water dissolves salt at a rate of approximately 100 to 250 cubic meters of salt per day per well at typical injection rates, depending on the salt purity, the injection rate, and the cavern geometry. The brine is pumped out at the surface to a disposal well or to a chlor-alkali industrial buyer who uses it as a chlorine and caustic soda feedstock.
The cavern shape is controlled by the relative depths of the injection and return strings, the injection rate, and the position of a “blanket” of compressed air, nitrogen, or diesel at the cavern roof that prevents upward dissolution and protects the caprock seal. Operators target specific volumes (5 to 15 Bcf of working gas at typical Gulf Coast cavities, smaller for bedded-salt) and specific shapes (cylindrical or pear-shaped, with a height-to-diameter ratio sufficient for cavern stability under operating pressure). Sonar surveys run periodically through the leaching process map the developing cavity. The full leaching sequence runs 12 to 24 months for a typical Gulf Coast storage cavern. The cavern is “dewatered” at the end (the residual brine is displaced by injecting gas, which pushes the brine to the surface for final disposal).
In service the cavern operates as a high-cycle pressure vessel. Injection compressors at the wellhead push gas down the wellbore against the cavern pressure, raising it from minimum operating pressure to maximum operating pressure over the injection season. Withdrawal opens the wellhead valves and allows gas to flow upward under cavern pressure, through a heater that prevents hydrate formation as the gas expands and cools, through a separator that drops out any liquids, and into the pipeline. Cycling rates of 5 to 12 turns per year are typical. The cavern’s lifespan is decades, limited by the gradual creep of the surrounding salt under cavern pressure and by the integrity of the wellhead and casing system that connects the cavity to the surface. The salt does not move quickly. It moves enough.
Depleted Reservoirs and Aquifer Storage Operation
A depleted oil or gas reservoir becomes a storage facility through a combination of subsurface engineering and surface infrastructure investment. The acquiring operator (typically an interstate pipeline, an LDC, or a merchant storage company) buys the depleted lease, the existing wellbore network, and the relevant surface facilities. The wellbore inventory is evaluated for reuse: many legacy production wells, drilled in the 1920s through the 1960s with then-current materials and standards, fail modern integrity testing and must be plugged, abandoned, or replaced. The remaining wells are recompleted as injection or withdrawal wells, with new tubing, new packers, new wellhead valves, and modern subsurface safety valves where required by post-Aliso Canyon regulation. New observation wells are drilled to monitor reservoir pressure, gas-water contact, and any migration to overlying or underlying formations.
Surface infrastructure includes the injection and withdrawal compression (typically 5,000 to 50,000 horsepower per facility, depending on the reservoir’s depth and target injection rate), the dehydration units that drop the moisture from withdrawn gas to pipeline-quality specifications, the meter and SCADA infrastructure that integrates the storage field with the connecting pipeline, and the brine disposal system if the reservoir produces water on withdrawal. Pennsylvania, West Virginia, and Michigan host the majority of US depleted-reservoir storage capacity by facility count, reflecting both the historical density of legacy gas production in those states and the geographic alignment of those reservoirs with the Northeast and Midwest demand centers. A typical facility holds 30 to 100 Bcf of working gas, with the largest fields (the Leidy storage complex in Pennsylvania, the Salt Plains storage in Oklahoma, the Cliffside helium storage facility’s gas component near Amarillo) holding 100 to 200 Bcf or more of working gas.
Aquifer storage is operationally similar but geologically distinct. The host formation is a porous sedimentary unit, typically a sandstone, that holds water in the pore space rather than residual hydrocarbons. Gas injected through the wellbore network displaces water laterally as the bubble grows, creating a gas-water contact that moves outward from the injection wells through the injection season and inward toward the wellbore network through the withdrawal season. The pressure response of an aquifer to injection and withdrawal is more variable than that of a depleted reservoir because the connected water column extends well beyond the gas bubble and the formation’s lateral connectivity is harder to characterize from the limited number of wells.
Northern Illinois Gas (Nicor Gas, since 2011 a subsidiary of AGL Resources, since 2016 part of Southern Company Gas) developed and has operated the Crystal Lake and Lake Bloomington aquifer storage fields in northern Illinois beginning in the 1950s. The Manlove Field in central Illinois, originally developed by Peoples Gas Light and Coke Company, is a third major Midwest aquifer operation. The Midwest aquifer fields filled the gap between the legacy depleted reservoirs of the Appalachians and Oklahoma and the urban demand of Chicago, Milwaukee, and Minneapolis at a time before the long-haul pipeline grid was complete. The geology dictated the technology. The technology dictated the inventory geography.
The EIA Weekly Storage Report and Price Discovery
The Energy Information Administration releases the Weekly Natural Gas Storage Report every Thursday at 10:30 a.m. Eastern Time. The report covers the storage week ending the prior Friday and reports working gas in underground storage at three levels: a Lower 48 total, the five regional totals (East, Midwest, Mountain, Pacific, and South Central), and the year-over-year and 5-year-average comparisons. The South Central region is further subdivided into salt and non-salt subregions to allow the market to track the high-cycle Gulf Coast salt cavern inventory separately from the lower-cycle depleted reservoir inventory in the same region. The report has been the headline scheduled data release in the US gas market since the EIA standardized the methodology and took over publication from the American Gas Association in 2002.
Market consensus for the report builds through the prior week. Bloomberg, Reuters, and S&P Global Commodity Insights (the former Platts) each conduct analyst polls in the days leading up to the release, publishing median, mean, and range estimates of the expected weekly change. Independent forecasters (BTU Analytics, Wood Mackenzie, RBN Energy, EBW Analytics) publish proprietary forecasts to clients. Weather forecasts (NOAA’s Heating Degree Day projections, the operational European and American models’ temperature ensembles) drive the forecasts in the heating season. Production estimates from the EIA’s Drilling Productivity Report and from commercial flow-data services (Genscape, now part of Wood Mackenzie; PointLogic, now part of S&P; ICE Network) drive the forecasts in the shoulder seasons.
The market response is immediate. The Henry Hub front-month futures contract on NYMEX, the prompt-month Algonquin Citygate physical basis, and the calendar-2 strip all reprice inside 30 seconds of the 10:30 a.m. release. A withdrawal 20 Bcf larger than the consensus expectation on a cold January week can move the prompt contract by more than 5 percent inside the first 60 seconds of trading. An injection 20 Bcf larger than expected on an early-October shoulder week can produce a similar move in the opposite direction. Algorithmic trading systems read the EIA release directly from the agency’s distribution feed and post orders into the central limit order book on a sub-second basis.
The structural reason for the report’s central role is the relative paucity of comparably authoritative, frequent, real-time supply-and-demand data on US gas. Production is reported by the EIA monthly (the Natural Gas Monthly) and by the Drilling Productivity Report and Short-Term Energy Outlook in modeled form, but the authoritative monthly state-level production data lags by 60 days or more. Demand is reported by sector (power, residential and commercial, industrial, vehicle fuel, lease and plant fuel) in the Natural Gas Monthly and by power sector specifically in the EIA Electric Power Monthly, again with a 60-day-plus lag. Imports and exports are reported monthly. Pipeline interstate flow data is published commercially by aggregators on a daily basis but is not government-verified. The Weekly Storage Report is the only authoritative, frequent, government-verified indicator of net US gas balance, and the entire market watches the same number at the same moment.
The Thursday release is the gas market’s equivalent of the Wednesday EIA Weekly Petroleum Status Report at the same agency, with one structural difference. The gas storage figure is an inventory level, not a flow, and the change-on-week is therefore the differential of two relatively well-measured stocks. The figure is harder to fudge than a weekly flow estimate. The market trusts it accordingly.
Storage Economics and the Seasonal Trade
The storage trade is the simplest commodity carry trade in energy markets. A trader buys summer gas at a production hub or at a pipeline interconnect, pays the pipeline to transport it to the storage field, pays the storage operator to inject and hold the gas through the injection season, and sells it back into the pipeline grid during the heating season. The trade’s profit is the calendar spread between the summer purchase and the winter sale, less the transport, injection, demand, and withdrawal charges.
The benchmark calendar spread is the November-minus-October Henry Hub futures spread (the “winter / summer roll” or, more precisely, the first-injection-month / first-withdrawal-month spread). When that spread is wide, third-party storage capacity earns its capital cost. When the spread is compressed, storage capacity earns thin margins and the merchant-storage business model comes under pressure.
The structural compression of the calendar spread that began with the Marcellus production ramp in 2010 to 2014 has reshaped the merchant storage industry. Marcellus production grew the available summer supply at the same time as flat-load LNG export demand and gas-fired power generation grew the year-round demand. The November-October Henry Hub spread, which had averaged $0.50 to $1.00 per MMBtu in the 2000s, compressed to $0.10 to $0.40 per MMBtu through much of 2018 to 2024. Independent merchant storage operators (the salt-cavern joint ventures that built capacity at Egan, Pine Prairie, Stagecoach, and the Niska Bath complex during the high-spread era) renegotiated rates downward, refinanced debt, and in several cases passed through changes of corporate ownership at depressed valuations. The Niska Gas Storage Partners take-private acquisition by Brookfield Infrastructure in 2017, the Crestwood / Stagecoach asset reshuffling through 2018 to 2022, and the eventual sale of Crestwood (with its Stagecoach assets) to Energy Transfer in November 2023 are the visible balance-sheet record of the spread compression.
The major utility-affiliated storage operators are not subject to the same merchant-margin pressure. Spectra / Enbridge, Williams, Kinder Morgan, the Berkshire Hathaway Energy gas pipelines, and the LDC-owned facilities allocate their storage capacity to firm utility customers under long-term cost-of-service tariffs filed at FERC. The capacity is held on behalf of the LDC’s residential and commercial customers (whose winter peak heating demand is the structural reason the storage capacity exists in the first place) and is not exposed to the calendar spread on the spot market. Firm storage demand charges in 2020 to 2024 have run $4 to $8 per Mcf-year for high-deliverability salt cavern service and $1 to $3 per Mcf-year for lower-deliverability depleted-reservoir service, with injection and withdrawal volumetric charges layered on top. The deeper mechanics of the futures curve and the basis market that determines how those charges actually clear in the spot market are taken up in Chapter 15. The storage trade is the carry. The curve sets the carry’s price.
Aliso Canyon and Storage Integrity Regulation
The Aliso Canyon SS-25 leak set US storage policy on a new track. The proximate failure was a casing leak at a single well, a vertical injection well drilled in 1953 for the Tidewater Oil Company’s original production from the Sesnon and Frew sands of the Aliso Canyon oil field. SoCal Gas converted the field to gas storage in 1971, retaining the existing wellbores under modified completions. SS-25 was reconfigured for gas storage service without installation of a subsurface safety valve and without periodic cement-bond logging that would have flagged the gradual external corrosion of the production casing. Over decades of cycling, the casing wall thinned to the point of failure. On Fri Oct 23, 2015, gas began escaping outside the casing and migrating to the surface.
Federal and state regulatory response moved quickly. The Pipeline and Hazardous Materials Safety Administration issued an interim final rule on Mon Dec 19, 2016, applying federal underground storage facility safety regulation to interstate gas storage operators for the first time and requiring operators to implement the relevant provisions of API Recommended Practice 1170 (salt cavern storage) and API Recommended Practice 1171 (depleted reservoir and aquifer storage). The rule mandated formal risk assessment, integrity-management plans, well-by-well integrity testing, periodic cement-bond logging, monitoring of subsurface safety valves where installed, and incident reporting to PHMSA on a federal timeline. The 2020 PIPES Act and a series of subsequent PHMSA rulemakings further extended and clarified the federal program through 2023.
The California Public Utilities Commission imposed additional state-level requirements on SoCal Gas at Aliso Canyon: a reduced working gas inventory cap, mandatory daily monitoring of every storage well at the field, and a rate-recovery limitation on the leak’s response and remediation costs. Aliso Canyon resumed limited operation in 2017 under the reduced inventory cap and continues to operate under that cap. The proceeding to determine the field’s long-term operating status, including whether to phase the field out of service entirely, has been pending at the CPUC since 2017 and has not been finally resolved. Every US storage operator now files an annual integrity-management report into a federal regime that did not exist in October 2015. The well that failed was 62 years old. The system the failure remade is not yet ten.
The 2014 Polar Vortex Drawdown
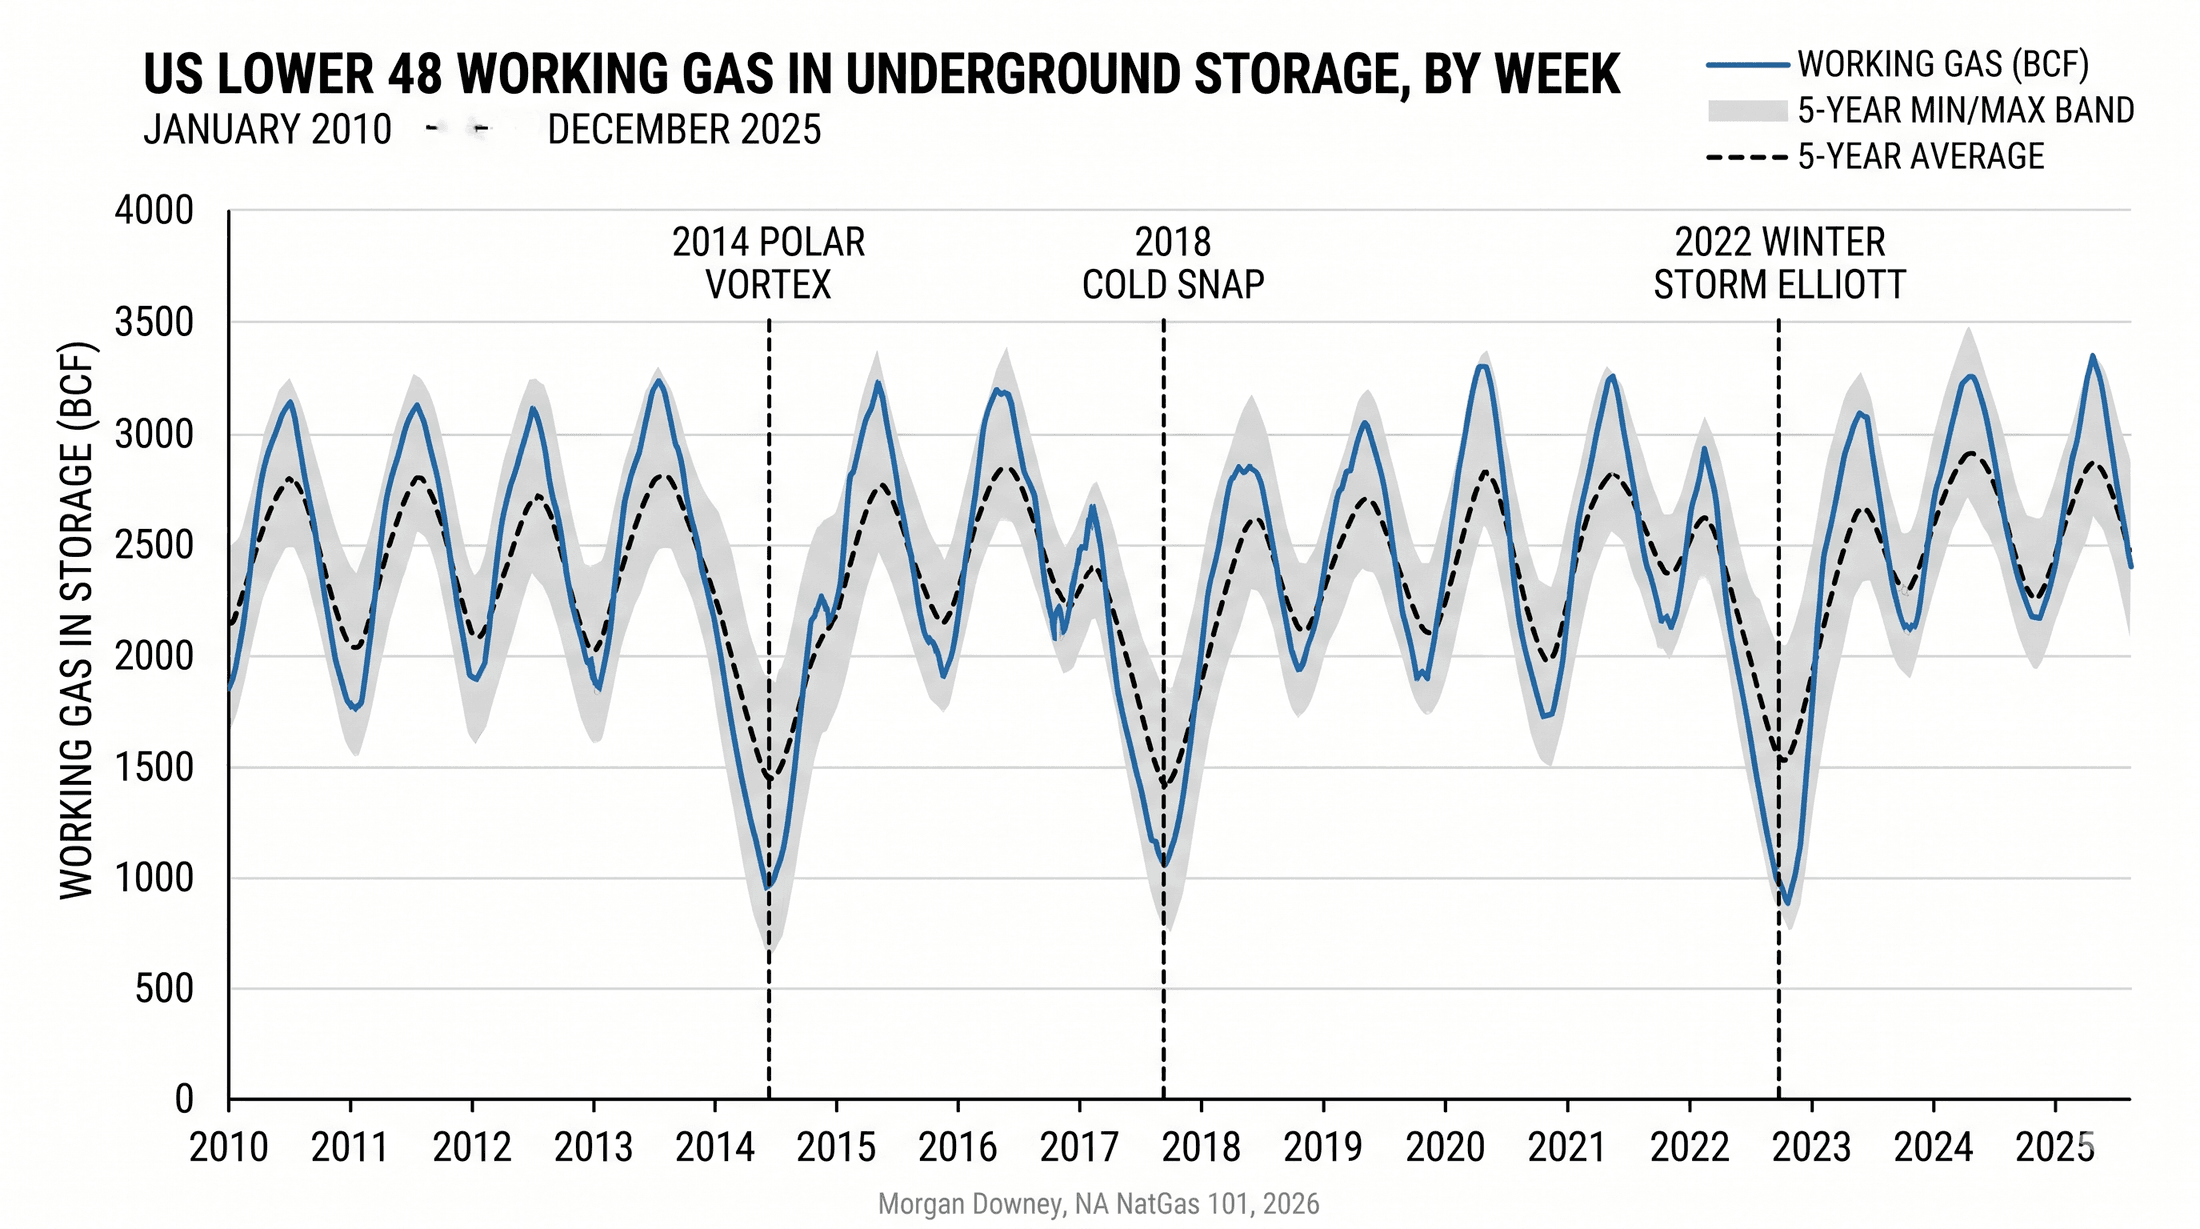
The week ending Fri Mar 28, 2014 marked the lowest US working gas inventory in five years. The EIA reported 822 Bcf in storage in the Lower 48, against a five-year average for the same week of 1,766 Bcf and a year-ago figure of 1,704 Bcf. The withdrawal season had begun in November 2013 with 3,829 Bcf in storage, more than 200 Bcf above the prior 5-year average. Five months of polar vortex withdrawals had pulled almost 3,000 Bcf out of the system, against a typical winter draw of approximately 2,200 Bcf.
The salt caverns held. The depleted reservoirs in Pennsylvania, West Virginia, and Michigan delivered through January and February at rates that vendors and engineers had modeled but had never witnessed in continuous operation. The bedded-salt facilities at Stagecoach and Steckman Ridge, only a few years in commercial service in 2014, demonstrated that high-cycle Northeast storage could deliver on the coldest days. By the following injection season, every major operator’s capital plan included additional high-deliverability capacity. The polar vortex was not the storage system’s failure mode. It was the proof of concept.
The storage system absorbs the seasonal mismatch between flat-line production and seasonal demand. The single largest demand-side consumer driving that mismatch is the gas-fired power generation fleet, the subject of Chapter 12.