Pipelines and Compression
The physics of moving gas across a continental grid, compressor station hydraulics, and the FERC regulatory frame that governs interstate transit.
On Fri June 14, 2024, the Mountain Valley Pipeline began commercial service. The 303-mile, 42-inch interstate gas line runs from Mobley in Wetzel County, northern West Virginia, south through Doddridge, Harrison, Lewis, and Webster counties, across the Appalachian spine into Virginia at Monroe County, and on through Giles, Craig, Montgomery, and Franklin counties to its terminus at the Transco mainline interconnect at Chatham in Pittsylvania County. Two billion cubic feet per day of design capacity. The project had been in active construction since 2018 and in active permitting since the 2014 FERC certificate filing.
The original 2014 budget was $3.5 billion. The final cost at commissioning was $7.85 billion. The doubling was driven by Fourth Circuit Court of Appeals vacaturs of multiple federal permits between 2018 and 2022, the Forest Service and Fish and Wildlife Service reauthorizations that followed each vacatur, the redesign of waterbody and karst-terrain crossings, the COVID-period inflation in line pipe and skilled construction labor, and the construction of more than 1,000 surface-water crossings to standards more restrictive than the original alignment had assumed. Construction fully resumed only after Congress inserted a provision into the Fiscal Responsibility Act of 2023, the bill that suspended the federal debt ceiling, that ratified MVP’s permits, declared the project to be in the national interest, and stripped federal court jurisdiction over further challenges to the listed authorizations.
The gas the pipe carries had been waiting. The southwest Virginia and southern West Virginia portion of the Appalachian dry-gas core had been bottlenecked behind takeaway scarcity for most of a decade. With MVP in service, EQT and other Appalachian producers route Marcellus and Utica residue gas into Transco Zone 5 and onward to the Carolinas, Georgia, and the Atlantic and Gulf Coast LNG terminals at Cove Point, Plaquemines, and Sabine Pass. The chapter that follows is the engineering, the regulation, and the contract architecture that make a pipe like MVP either a 60-month project or a 120-month project.
Gas Flow Physics and Pipeline Hydraulics
The pressure drop along a section of high-pressure gas pipe is governed by the equations of compressible flow, simplified for engineering use. Three forms dominate US transmission-pipeline design and throughput calculation. The Weymouth equation is the oldest, used for short, large-diameter, fully turbulent lines where friction is dominated by pipe-wall roughness. The Panhandle A equation is tuned for partially turbulent flow at moderate Reynolds numbers and is the workhorse for many long-haul interstate calculations. The Panhandle B equation, calibrated by El Paso Natural Gas in the 1950s for very long, very large-diameter mainlines at higher Reynolds numbers, is the standard for the largest modern systems.
Each equation relates gas flow rate Q at standard conditions to inlet pressure P1, outlet pressure P2, pipe diameter d, pipeline length L, gas specific gravity, gas average flowing temperature, base pressure and temperature, and a friction or efficiency factor. The mathematical form is similar across the three. Q is proportional to the square root of P1 squared minus P2 squared, divided by the square root of specific gravity times length times absolute temperature, multiplied by diameter raised to a power. Two consequences for the reader. First, halving the pipeline length doubles capacity at the same inlet and outlet pressures, because flow scales with the square root of length in the denominator. Second, doubling the pipe diameter does much more than double capacity. In Weymouth, capacity scales with diameter to the 2.667 power, so doubling diameter multiplies capacity by roughly 6.3. In Panhandle B, capacity scales with diameter to the 2.53 power, so doubling diameter multiplies capacity by roughly 5.8. The economic implication: a single 42-inch pipe carries roughly four to six times what a single 24-inch pipe carries at the same pressures and length. Modern interstate mainline projects default to 42 inches for this reason.
Operating pressure on US interstate mainlines runs from 800 to 1,500 psig in normal service, with peak excursions above 1,500 psig on the largest modern systems. The Maximum Allowable Operating Pressure for a given pipe is set by the pipe’s wall thickness, the steel grade’s yield strength, and the safety factor required by the federal pipeline safety regulation in 49 CFR Part 192. The applicable design factor is 0.72 in low-population-density Class 1 areas, dropping to 0.60, 0.50, and 0.40 for Class 2, 3, and 4 areas as population density rises. A new pipeline is typically built with thicker wall in higher-class areas so the entire system can run at the same MAOP.
Pipe metallurgy is API 5L carbon steel, manufactured from electric-resistance-welded or submerged-arc-welded plate. Grades X65 through X80 are standard for new long-haul construction; X70 is the most common grade on major modern projects because of its balance of yield strength, weldability, and field-bending ductility. Wall thickness on a 42-inch X70 line designed for 1,440 psig MAOP is typically 0.625 to 0.875 inches depending on class location. The pipe is coated externally with fusion-bonded epoxy for corrosion protection, lined internally with epoxy for flow efficiency on long-haul service, and protected by a buried impressed-current cathodic protection system that reverses any galvanic corrosion potential at the pipe-soil interface.
Compressor Stations
Friction with the pipe wall causes pressure to drop as gas moves down the line. The hydraulic profile of a typical 42-inch interstate mainline at full design throughput shows pressure falling roughly 1,000 psig over 100 miles of pipe before a compressor station restores it. Station spacing on US interstate mainlines runs from 50 miles in dense, high-throughput corridors (Transco’s Northeast leg, Tennessee Gas Pipeline’s southern segments) to 150 miles or more on long-haul Western lines crossing low-population terrain (Northwest Pipeline, El Paso). Spacing is dictated by the diameter, the design throughput, the elevation profile, and the density of nearby delivery and receipt points.
Two prime-mover technologies dominate. Gas-turbine-driven centrifugal compressors are the standard for new mainline stations above 10,000 horsepower per unit, where the high power density, the low maintenance frequency, and the capacity to swing throughput on a single shaft make them the economic choice. The Solar Centaur 50 (roughly 6,000 hp ISO), the Solar Taurus 60 (roughly 7,500 hp), the Solar Taurus 70 (roughly 11,000 hp), and the Solar Mars 100 (roughly 16,000 hp) cover most US station applications, with the larger GE Frame 5 (roughly 25,000 to 30,000 hp) and Siemens SGT-300/400/600 (roughly 8,000 to 25,000 hp depending on model) used on the largest mainline duties. Reciprocating engines driving reciprocating compressors (Caterpillar G3500 and G3600 series, Waukesha VHP and 9300 series) dominate at smaller stations and on regional gathering compression where the duty cycle, the ability to handle wide suction-pressure ranges, and the ability to operate efficiently below full load favor reciprocating designs.
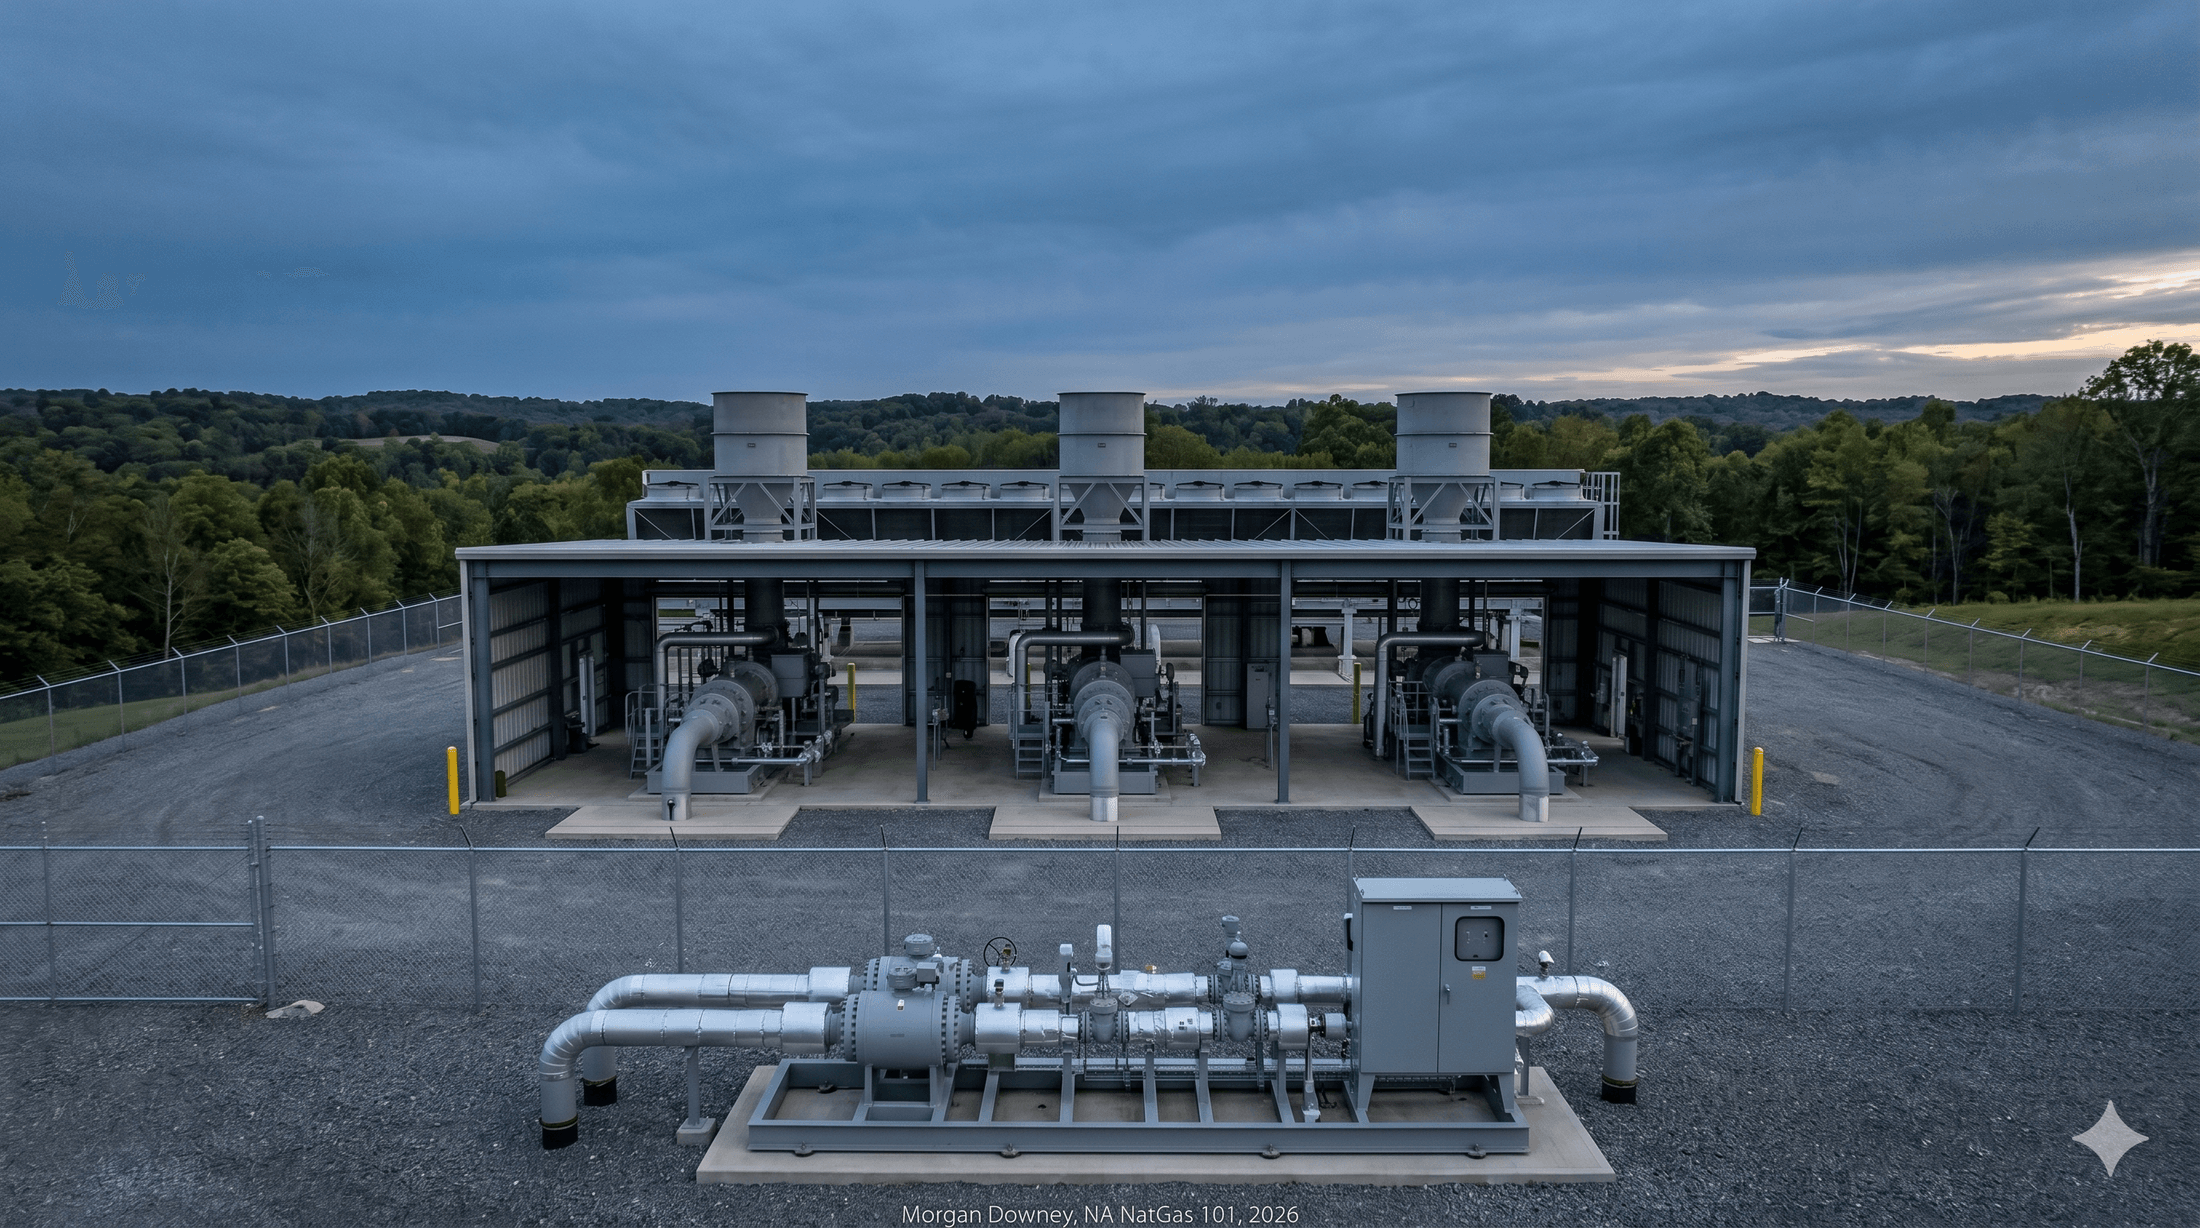
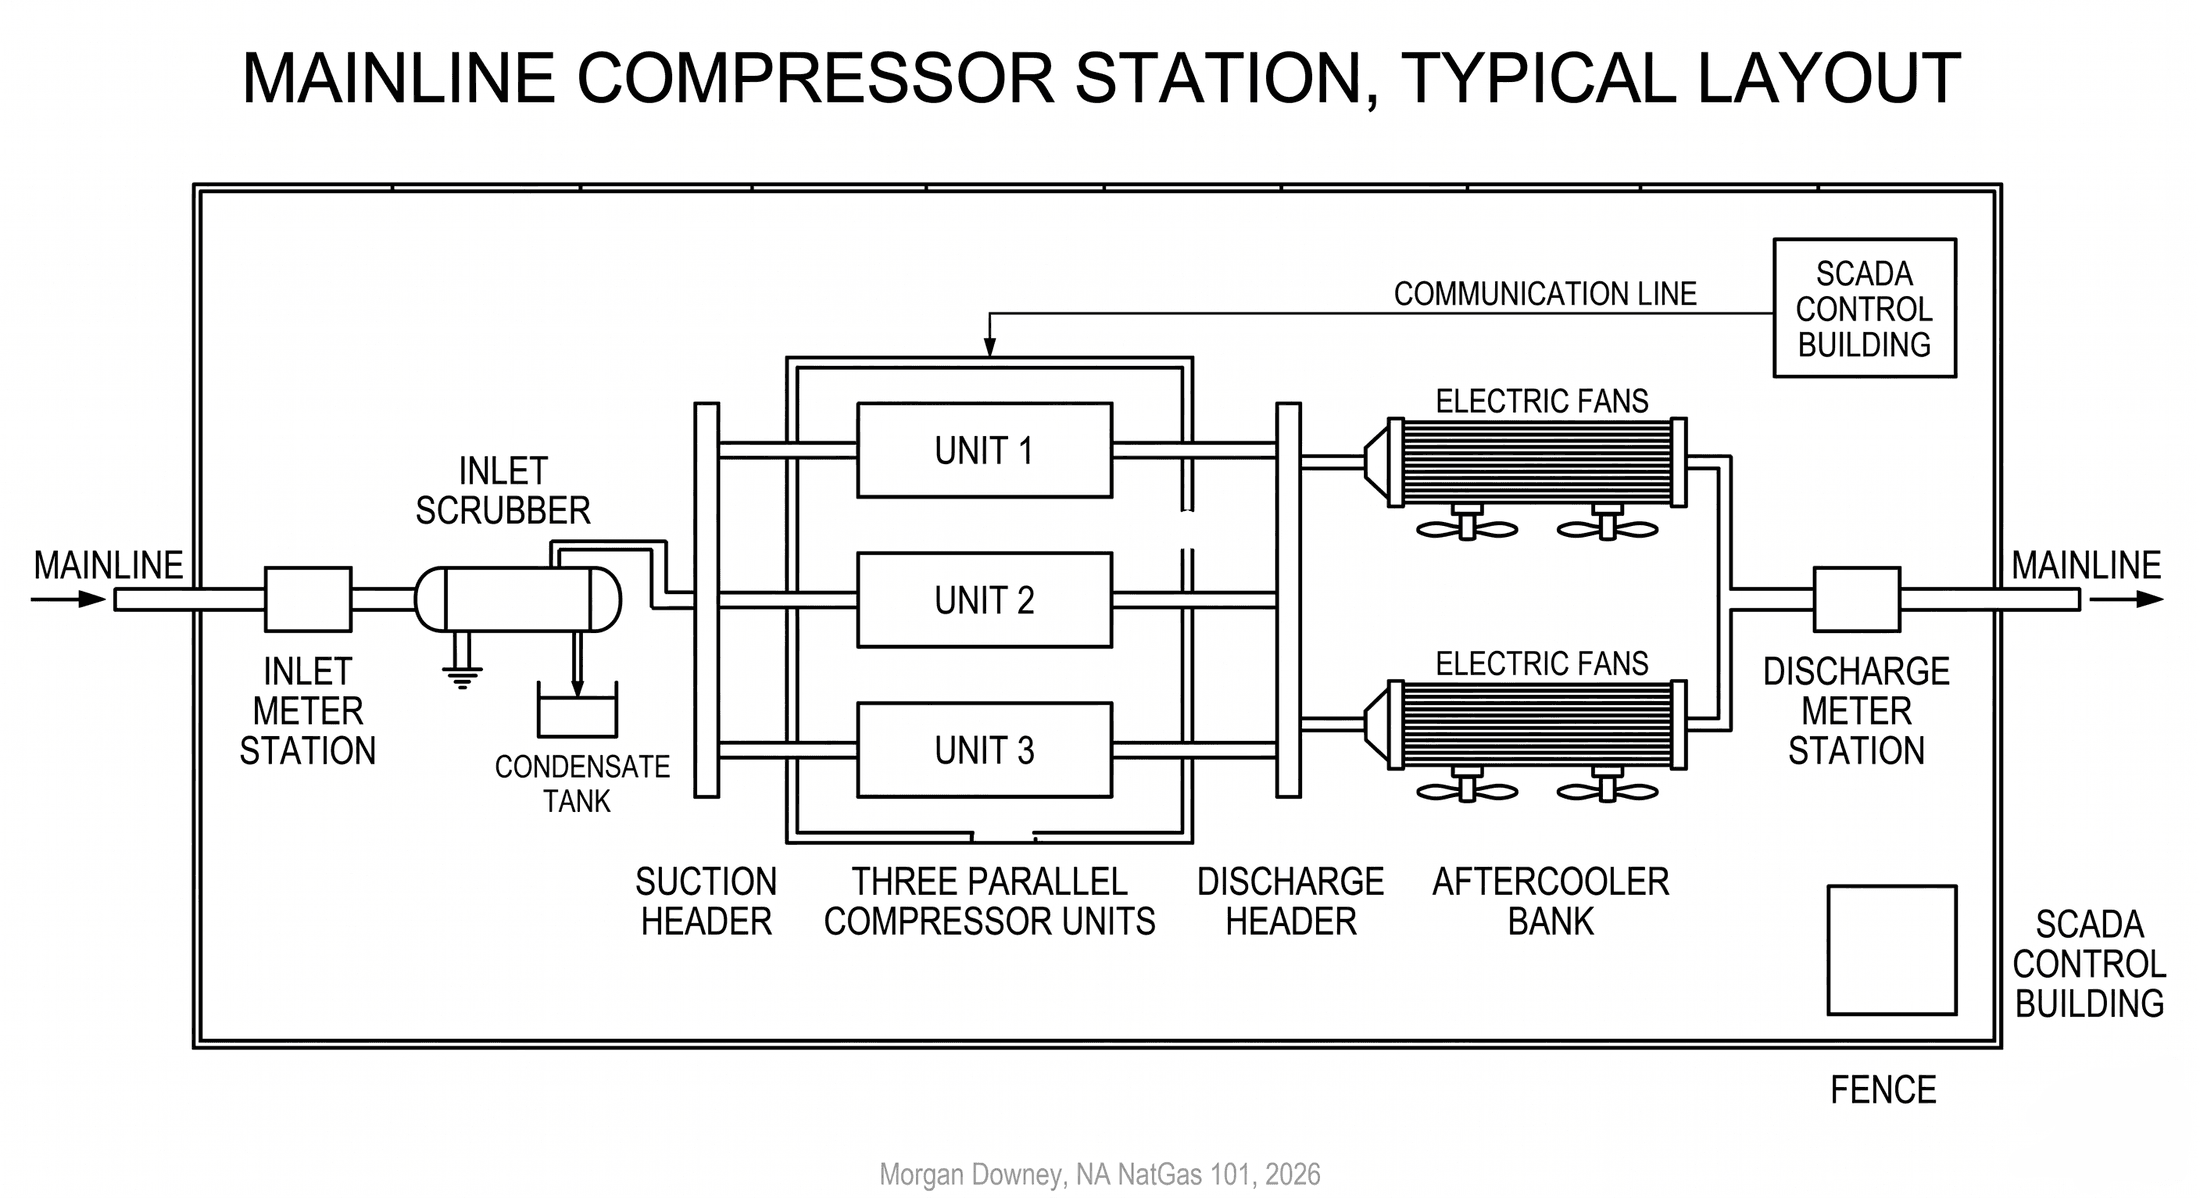
A typical mainline compressor station houses three to six units, with total installed horsepower between 20,000 and 50,000 hp. The station footprint is several acres, fenced, lit, and unmanned for routine operation. The gas enters the station through an inlet scrubber that drops out any liquids that have condensed in the upstream pipe segment. The scrubbed gas enters the suction header, passes through one or more centrifugal compressors that boost it from suction pressure (typically 700 to 900 psig) to discharge pressure (typically 1,300 to 1,500 psig), and exits through an aftercooler bank of forced-draft air-cooled exchangers that reject the heat of compression to the atmosphere before the gas re-enters the mainline. The discharge meter station records the volume that the station has handled, and the SCADA system reports flowing pressure, temperature, fuel rate, and unit-by-unit availability to a central operations center.
Fuel consumption is the largest operating cost. The gas turbine burns a slipstream from the discharge as fuel gas, typically 1.5 to 3 percent of the throughput on a Lower 48 mainline, rising to 4 percent or higher on long-haul lines that cross the Continental Divide or that operate at extreme suction-discharge pressure ratios. Across the Lower 48 the aggregate compressor fuel burn is on the order of 800 to 1,000 billion cubic feet per year, equivalent to roughly 2 to 3 percent of dry gas production. Electric-motor-driven compressors are deployed on a small but growing share of new builds, particularly where the local electric grid is decarbonized and where federal and state methane regulations make the venting and slippage from gas-turbine units commercially expensive. Electric drives shift the fuel cost off the pipeline’s gas balance and onto the local electric utility’s bill.
Maintenance follows the manufacturer schedule. Solar centrifugals run between major overhauls every 30,000 to 50,000 fired hours, with hot-section inspections at intermediate intervals. A 5-unit station typically rotates one unit through overhaul each year on a planned cycle, so total station capacity is rarely available at 100 percent. Unplanned outages happen, and the pipeline’s tariff and contract structure account for that through firm-versus-interruptible service tiers. Compressor station mechanical availability is the visible operational metric that determines what fraction of contracted firm capacity can actually be delivered on a given winter morning.
The Interstate Pipeline Grid Topology
The US interstate gas pipeline grid grew up in three overlapping waves. Each wave answered a different supply-and-demand geography, and the grid as it stands today is a sediment of all three.
The first wave, from the 1930s through the 1960s, built the long-haul lines that connected the Texas, Louisiana, and Hugoton-Anadarko gas fields to the urban demand centers of the Midwest and the Northeast. Tennessee Gas and Transmission Company (now Tennessee Gas Pipeline, a Kinder Morgan asset since the Kinder Morgan acquisition of El Paso Corporation in 2012) was incorporated in 1940 and completed its original line from south Texas to West Virginia by 1944, then extended into New England through the late 1940s and the 1950s. Transcontinental Gas Pipeline (Transco, now Williams) was certificated in the late 1940s and put in service around 1950, running from south Texas through Louisiana, Mississippi, Alabama, Georgia, and the Carolinas to a terminus on New York Harbor. Texas Eastern Transmission (now Enbridge, after Enbridge acquired Spectra Energy in 2017) was built in 1947 by converting the wartime Big Inch and Little Big Inch oil pipelines to gas service, running from Longview, Texas to the Philadelphia and New York metropolitan markets. Northern Natural Gas (now Berkshire Hathaway Energy) built the line from the Hugoton-Anadarko region to Minneapolis-St. Paul and the Upper Midwest beginning in 1930. Panhandle Eastern Pipe Line (now Energy Transfer) connected the Texas Panhandle to Indianapolis and Detroit by the early 1950s. By 1970 the basic geography of the long-haul gas grid was settled.
The second wave, from the 1970s through the 1990s, built the regional and distribution-area interconnects, the trunk extensions into Florida (Florida Gas Transmission, now jointly owned by Energy Transfer and Kinder Morgan), the Rocky Mountains and the Pacific Northwest (Northwest Pipeline, now Williams), and the offshore Gulf of Mexico gathering and transmission systems that fed the mainland trunk lines. The Federal Power Commission and its 1977 successor the Federal Energy Regulatory Commission certificated dozens of new lines, expansions, and looping projects through this period. The 1992 Order 636 unbundling, covered in the next section, restructured the contractual basis on which all of these pipelines operated and forced an architectural shift from bundled merchant service to common-carrier transportation. The pipes themselves did not move; the contracts under which they operated changed.
The third wave, from 2007 onward, was driven by the shale revolution. Marcellus and Utica gas displaced Gulf Coast and Mid-Continent gas as the marginal supply to the Northeast, the Permian and Haynesville displaced the Mid-Continent and the Rockies as the marginal supply to the Gulf Coast LNG corridor, and the historical south-to-north and west-to-east flow directions reversed across multiple major pipelines. The Rockies Express Pipeline (REX), built from 2007 to 2009 by a Kinder Morgan, Sempra, and ConocoPhillips consortium and now operated by Tallgrass Energy, was originally a 1.8 Bcf/d eastbound line from Wyoming through Colorado, Nebraska, Missouri, and Illinois to Clarington, Ohio. By 2014 the Marcellus had pushed Eastern US prices below Rocky Mountain prices and REX progressively reversed, with eastbound flow on its western segments and westbound flow on its eastern segments. Williams’ Atlantic Sunrise project on Transco added 1.7 Bcf/d of southbound Marcellus takeaway when it entered service in October 2018. The Permian takeaway pipelines (Whistler, Permian Highway, Matterhorn Express, and the legacy Gulf Coast Express) were built between 2017 and 2024 to carry Permian associated gas east to the Houston and Corpus Christi LNG corridor. The Haynesville takeaway projects (DT Midstream’s LEAP, Momentum Midstream’s NG3, and Williams’ Louisiana Energy Gateway, in various stages of construction or operation) carry Haynesville gas south to the Gillis hub and the LNG corridor on the Sabine and Calcasieu river channels.
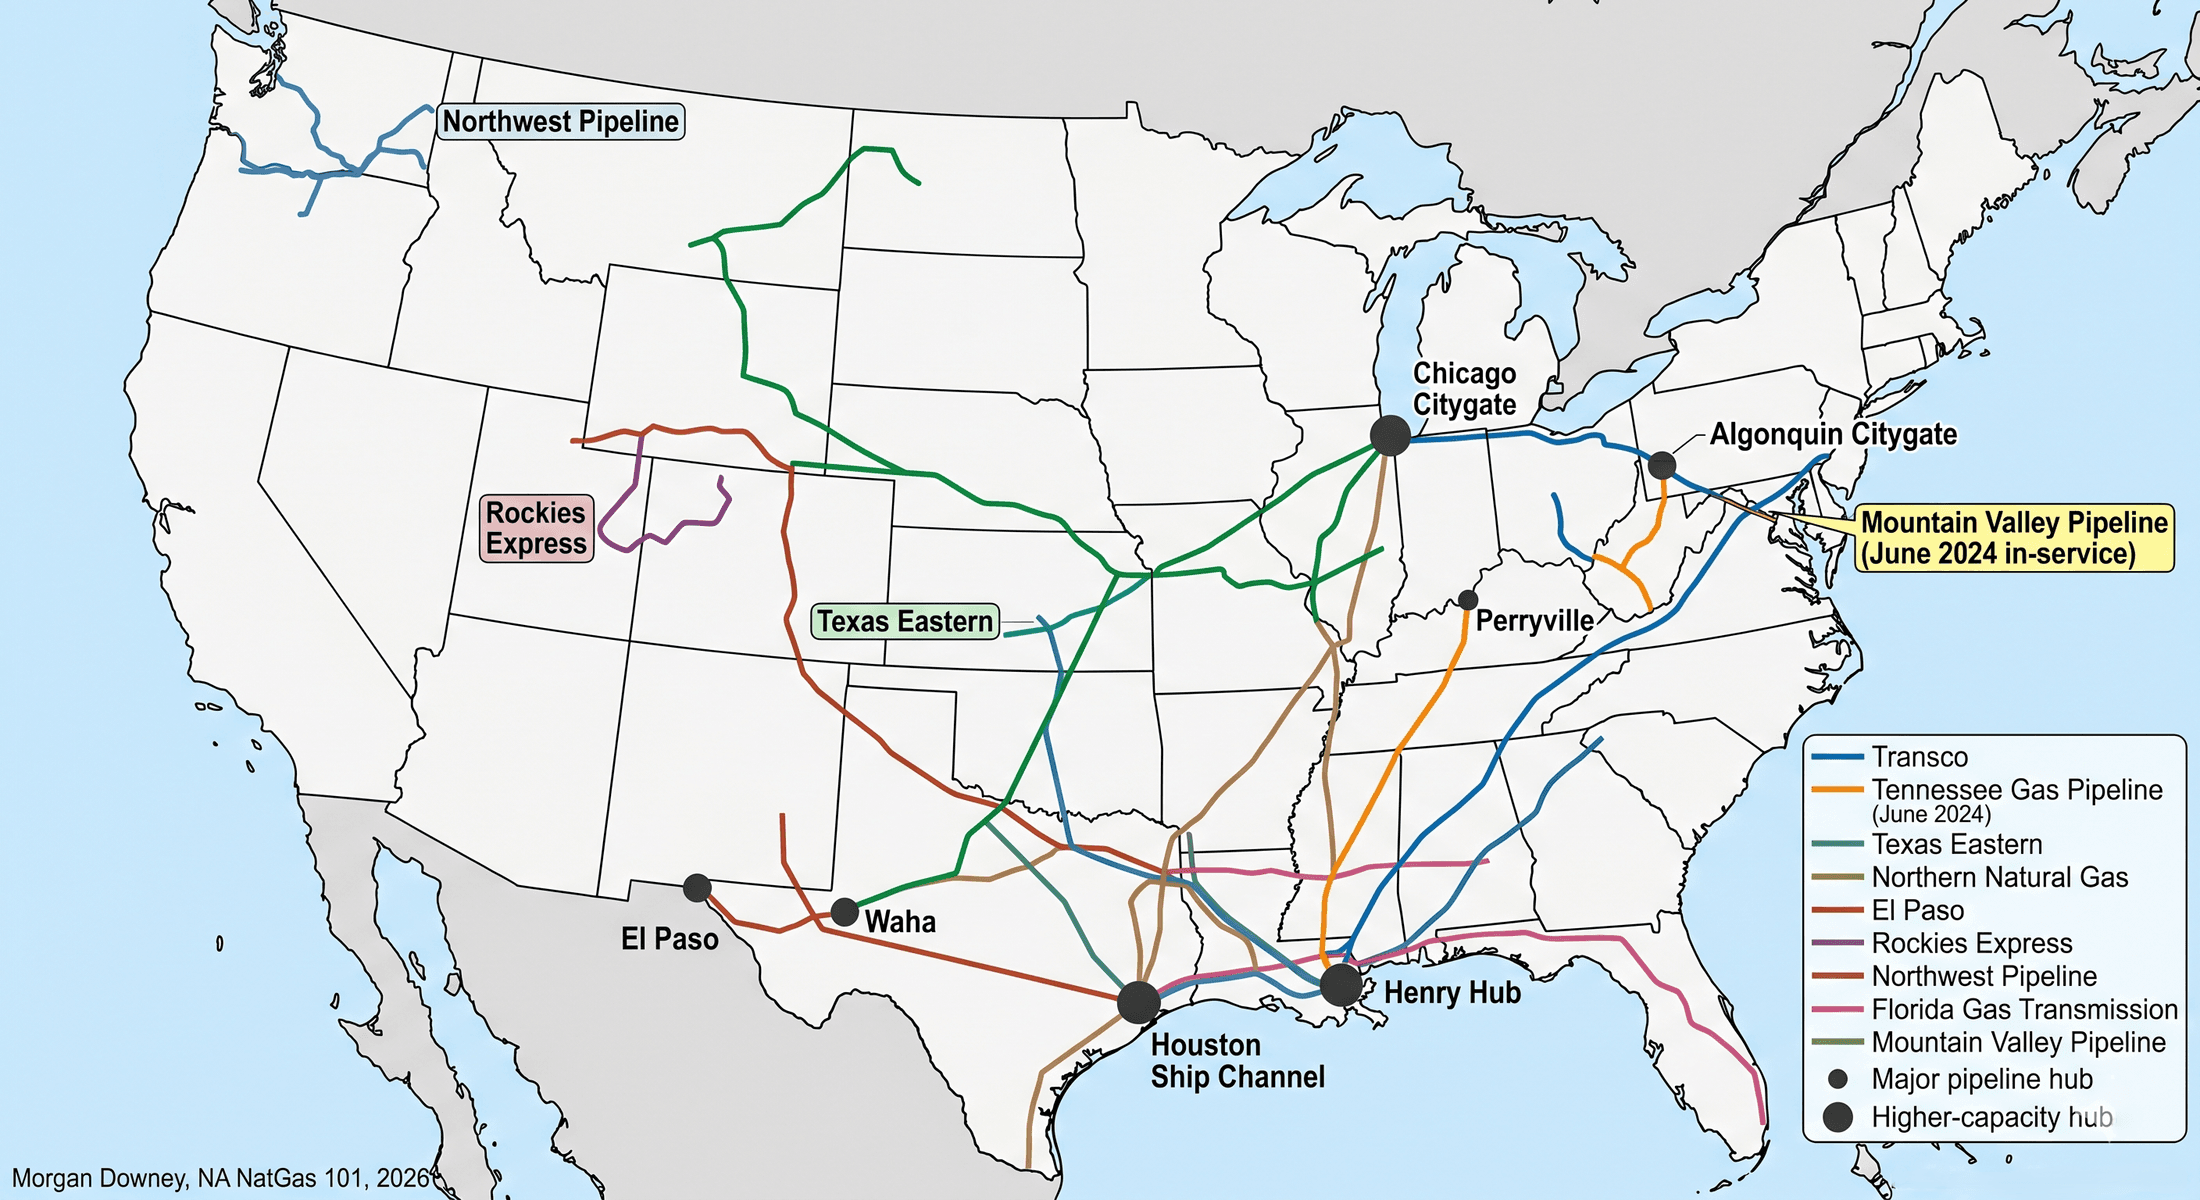
Major US interstate pipelines and their current operators, by route:
- Transco (Williams). South Texas and Louisiana through the Southeast to New York Harbor. The largest US interstate by throughput, with peak winter deliveries above 18 Bcf/d into the Northeast.
- Tennessee Gas Pipeline (Kinder Morgan). Gulf Coast and Texas to New England, with major connections in Pennsylvania, New York, Massachusetts, and Connecticut.
- El Paso Natural Gas (Kinder Morgan). Permian and San Juan basins to Southern California through Arizona.
- Texas Eastern Transmission (Enbridge). Gulf Coast to the Northeast, paralleling Transco for much of the route through the Mid-Atlantic.
- Northern Natural Gas (Berkshire Hathaway Energy). Texas Panhandle and the Mid-Continent to the Upper Midwest.
- Columbia Gas Transmission (TC Energy). The Appalachian and Mid-Atlantic gas grid; retained by TC Energy after the October 2024 spin-off of the company’s liquids pipeline business as South Bow.
- Rockies Express Pipeline (Tallgrass Energy). Wyoming and Colorado eastward to Ohio, now bidirectional.
- Mountain Valley Pipeline (operated by Equitrans Midstream as a joint venture among Equitrans, NextEra, Con Edison, AltaGas, and RGC Resources). Wetzel County, West Virginia to the Transco interconnect at Chatham, Virginia. In service June 2024.
- Sabal Trail Transmission (Williams, Enbridge, and NextEra Energy joint venture) and Florida Gas Transmission (Energy Transfer and Kinder Morgan joint venture). Gulf Coast to peninsular Florida.
- Northwest Pipeline (Williams). The Rocky Mountain producing basins through Idaho and Oregon to Washington and the Pacific Northwest.
The grid is dense. About 300,000 miles of high-pressure transmission line connects to roughly 2.6 million miles of distribution piping at the city-gate stations operated by the local distribution companies. The interconnections among the long-haul lines, particularly at the Henry Hub in Erath, Louisiana and at the Perryville hub in northeast Louisiana, give the system the physical optionality that the spot market and the futures contract depend on.
FERC and the Regulatory Framework
The Natural Gas Act of 1938 established federal jurisdiction over interstate gas transportation and over wholesale sales for resale in interstate commerce. The Act left intrastate sales, gathering, and local distribution to state regulation. The Federal Power Commission administered the NGA from 1938 to 1977. Congress reorganized the FPC into the Federal Energy Regulatory Commission in 1977 as part of the Department of Energy Organization Act, and FERC has administered the interstate gas pipeline program ever since. Three regulatory pillars structure the modern business.
The first is the Section 7 certificate of public convenience and necessity. Any new interstate gas pipeline construction, any expansion of existing capacity, any change in transportation service from one set of receipt and delivery points to another, and any abandonment of existing facilities require a Section 7 certificate from FERC under the NGA. The application process runs through an environmental review under the National Environmental Policy Act (typically an Environmental Impact Statement on a major mainline project, an Environmental Assessment on a smaller looping or station project), a public comment period, coordination with cooperating federal agencies (Forest Service, Fish and Wildlife Service, Army Corps of Engineers, EPA, and the relevant state agencies), and a final Commission order. The certificate, when issued, conveys eminent domain authority on the pipeline operator under Section 7(h) of the NGA, allowing the operator to acquire the linear right-of-way through condemnation in federal district court when negotiated easements with surface owners are unsuccessful. Section 7 timelines have lengthened materially over the past 30 years. A typical major modern certificate application runs 36 to 60 months from filing to final order, against the 12 to 18 months that was typical for comparable projects in the 1990s.
The second pillar is Order 636, issued in April 1992, which restructured the merchant function of interstate pipelines. Before Order 636, an interstate pipeline operated as a vertically integrated merchant: it bought gas at the wellhead, transported the gas through its own pipe, and sold the gas as a bundled commodity-and-transport product to local distribution companies. Order 636 required pipelines to unbundle the merchant function from the transport function, to offer open-access transportation on nondiscriminatory terms to any qualifying shipper, and to exit the merchant business. Producers and end-users now contract directly with each other for the underlying commodity and contract separately with the pipeline for firm or interruptible transportation. The capacity is allocated by tariff, the tariff is filed with FERC, and the rates are subject to cost-of-service review. Order 636 is the single most consequential FERC order in the modern history of the US gas market. The liquid spot market and the Henry Hub futures contract exist because of it.
The third pillar is the tariff and the rate case. Each interstate pipeline files a tariff with FERC that specifies the maximum rates, terms, and conditions under which the pipeline will provide firm transportation, interruptible transportation, storage, and ancillary services. Major rate changes go through either Section 4 proceedings (initiated by the pipeline) or Section 5 proceedings (initiated by FERC). The Commission applies cost-of-service rate-making, allocating the pipeline’s depreciated rate base, the operator’s allowed return on equity, the operator’s tax allowance, and the operator’s operating expenses across firm and interruptible shippers in proportions set by Commission rate-design precedent. The rate case is the slow, technical battleground on which pipelines and shippers contest hundreds of millions of dollars in annual revenue requirement. Most rate cases settle before final order; those that go to hearing run two to four years and set the precedent for the next case.
Pipeline Construction, Capital Costs, and Project Economics
A new long-haul interstate gas pipeline costs $4 to $7 million per mile in the Lower 48 in 2020s dollars. The lower end of the range covers 36-inch and 42-inch diameter projects in moderate terrain (the Gulf Coast plain, the Appalachian plateau, the Permian basin staging ground) where the right-of-way clears easily, the trenching encounters predictable soil, and the major waterbody crossings are manageable. The upper end covers 30-inch and 36-inch projects in mountainous, geologically complex, or environmentally constrained terrain (the Allegheny ridge crossings on Mountain Valley and the canceled Atlantic Coast project, the Cascade range crossings on the canceled Pacific Connector project, the wetland-heavy Florida segments on Sabal Trail).
Cost components break down across roughly five categories. Line pipe (the steel itself, fabricated and shipped to the pipe yard) accounts for 15 to 25 percent of the project cost, with the share rising when steel input prices spike. Construction labor and right-of-way restoration accounts for 40 to 50 percent and includes the welding crews, the equipment operators, the erosion controls, the topsoil management, and the post-construction restoration to pre-construction conditions. Right-of-way acquisition and surveying accounts for 5 to 10 percent and includes both the easement payments to surface owners along the route and the survey, title, and condemnation work that establishes the linear corridor. Compressor stations account for 10 to 15 percent, depending on how many stations the route requires and on the unit selection. Regulatory work (the FERC certificate application, the environmental impact statement, the cooperating-agency consultations, and the legal defense of the certificate against intervenor challenges) accounts for 5 to 10 percent. Project contingency accounts for the remaining 10 to 15 percent and is the line item that swells when the project encounters scope, schedule, or political surprise.
Project economics are anchored on shipper precedent agreements signed before the FERC certificate application is filed. Shippers (typically a mix of producers, marketers, local distribution companies, power generators, industrial end-users, and LNG developers) commit to 15-to-25-year firm transportation contracts under which they pay a monthly reservation charge for a maximum daily quantity of capacity, regardless of whether they actually nominate the gas. The reservation charges underwrite the pipeline’s debt service and its allowed return on equity. The pipeline reaches Final Investment Decision when contracted capacity exceeds a project-specific threshold, typically 50 to 70 percent of the line’s design capacity. Below that threshold the project’s lenders will not commit, the operator’s board will not approve the spend, and the project sits on the shelf waiting for additional precedent agreements.
Mountain Valley illustrates the asymmetry. The original 2014 budget of $3.5 billion was based on a 60-month FERC certificate timeline, on standard waterbody and forest-crossing permits, and on then-current line pipe and labor costs. The final cost of $7.85 billion in 2024 reflects the doubling of the construction window from 60 to 120 months, the redesign of more than 1,000 surface-water crossings to revised standards, the COVID-period inflation in steel and skilled labor, and the legal cost of defending and recovering the federal permits that the Fourth Circuit Court of Appeals vacated multiple times between 2018 and 2022. The shipper precedent agreements and the legislative ratification together kept the project economically viable. For the next major Appalachian takeaway project, the Mountain Valley experience is the cost-and-schedule baseline that prospective shippers and lenders will assume.
Capacity, Firm versus Interruptible, and the Capacity Release Market
Pipelines sell capacity in two basic flavors. Firm transportation guarantees the shipper delivery up to the contracted Maximum Daily Quantity, takes priority over all other classes of service when the pipeline cannot serve everyone, and pays a fixed monthly reservation charge (the demand charge) plus a small per-Mcf or per-Dth usage charge when the shipper actually nominates volume. Interruptible transportation has no daily guarantee, is curtailed first when firm shippers nominate their full contracted capacity, and pays only a per-Mcf usage charge with no reservation. Most pipeline capacity in the Lower 48 is sold under firm contracts to local distribution companies (utility-scale demand for residential and commercial heating), to merchant gas-fired power generators (combined-cycle baseload, peaking, and intermediate units), to industrial end-users (chemicals, steel, glass, refining), and, since the 2016 commissioning of Sabine Pass Train 1, to liquefaction terminals on the Gulf and Atlantic coasts. The LDC and LNG segments anchor the firm-capacity book on most major pipelines. The merchant power and industrial segments fill the remaining firm capacity and most of the interruptible volume.
The capacity release market is the secondary market in which firm shippers temporarily release unused capacity to other shippers at negotiated rates. A New England LDC that contracts for firm winter capacity on Tennessee Gas Pipeline nominates its full Maximum Daily Quantity on the coldest 20 days of the year, but on the warmer 200 days uses only a fraction of its firm capacity. The unused capacity has commercial value to a marketer or a power generator who is willing to pay to nominate gas through that capacity for a day, a week, or a season. The capacity release transaction posts on the pipeline’s electronic bulletin board, the bid-and-ask process determines the release rate, and the release rate is capped at the pipeline’s tariff-specified maximum reservation rate for the same point-to-point service. The capacity release rate, observed daily across major delivery zones, is the cleanest available price signal for the locational scarcity of pipeline capacity. When Algonquin Citygate in eastern New England prints capacity release rates many times the maximum tariff rate, it is the visible signature of pipeline scarcity that the futures basis market then arbitrages.
Capacity release is the focus of an extensive regulatory and contractual literature; the deeper mechanics (pre-arranged release versus posted release, recall and replacement rights, asset management arrangements, the affiliate-transaction safeguards, the NAESB scheduling protocols) are taken up in Chapter 16. The relevant point for the physical grid is that firm capacity is the contractual currency that allocates the limited daily throughput of the pipeline among competing demand-side bidders, and that the price of that contractual currency on any given day is set by what the pipeline’s most stressed delivery zones will pay to move the next molecule.
The Post-Shale Build-Out and the Regulatory Bottleneck
The shale revolution after 2008 inverted the geography of US gas supply. Before the revolution, US gas flowed primarily north and east from the Gulf Coast and from the Hugoton-Anadarko region toward the Northeast and the Midwest demand centers. The Marcellus and Utica plays, the Permian associated-gas growth, and the Haynesville production rebound restructured those flow vectors over the course of fifteen years. Marcellus and Utica gas now flows south, west, and into the Atlantic seaboard from a producing region in southwestern Pennsylvania, northern West Virginia, and eastern Ohio that produces over 30 Bcf/d, more than any other single producing region in the United States. Permian associated gas, the byproduct of Wolfcamp and Bone Spring oil drilling, now flows east through the Whistler, Permian Highway, Matterhorn Express, and Gulf Coast Express takeaway lines to the Houston and Corpus Christi LNG corridor. Haynesville dry gas now flows south to the Gillis hub and the Sabine and Calcasieu LNG corridor.
The pipeline grid has restructured in two ways. The first is reversal. The Rockies Express Pipeline reversed flow direction over its eastern segments through 2014 to 2017 to carry Marcellus gas west toward Ohio and Indiana. The ANR Pipeline (TC Energy) added southbound flow capacity to carry Marcellus gas south through the Mid-Continent. Transco’s Atlantic Sunrise expansion added 1.7 Bcf/d of southbound Marcellus takeaway when it entered service in October 2018. Each reversal required FERC authorization and an extensive engineering rework of compressor station configurations originally designed for the opposite direction.
The second restructuring vector is new construction, and that is where the regulatory bottleneck has become binding. Atlantic Coast Pipeline, a 600-mile, 1.5 Bcf/d project from West Virginia through Virginia to North Carolina sponsored by Dominion Energy and Duke Energy, was canceled in July 2020 after a federal appellate court vacated a US Forest Service permit for the Appalachian Trail crossing, with approximately $3.4 billion in sunk costs. Constitution Pipeline, a 124-mile project from northeastern Pennsylvania to the Iroquois Gas Transmission interconnect in Schoharie County, New York, was canceled in February 2020 after years of New York state water quality certification denials and the inability to obtain the federal permits that depended on the state action. PennEast Pipeline, a 116-mile project from Luzerne County, Pennsylvania to Mercer County, New Jersey, was canceled in September 2021 despite a Supreme Court ruling earlier the same year that upheld federal eminent domain authority over state-owned land. Mountain Valley required federal legislation, the ratification provision in the Fiscal Responsibility Act of 2023, to clear the final permitting obstacles after a decade of construction.
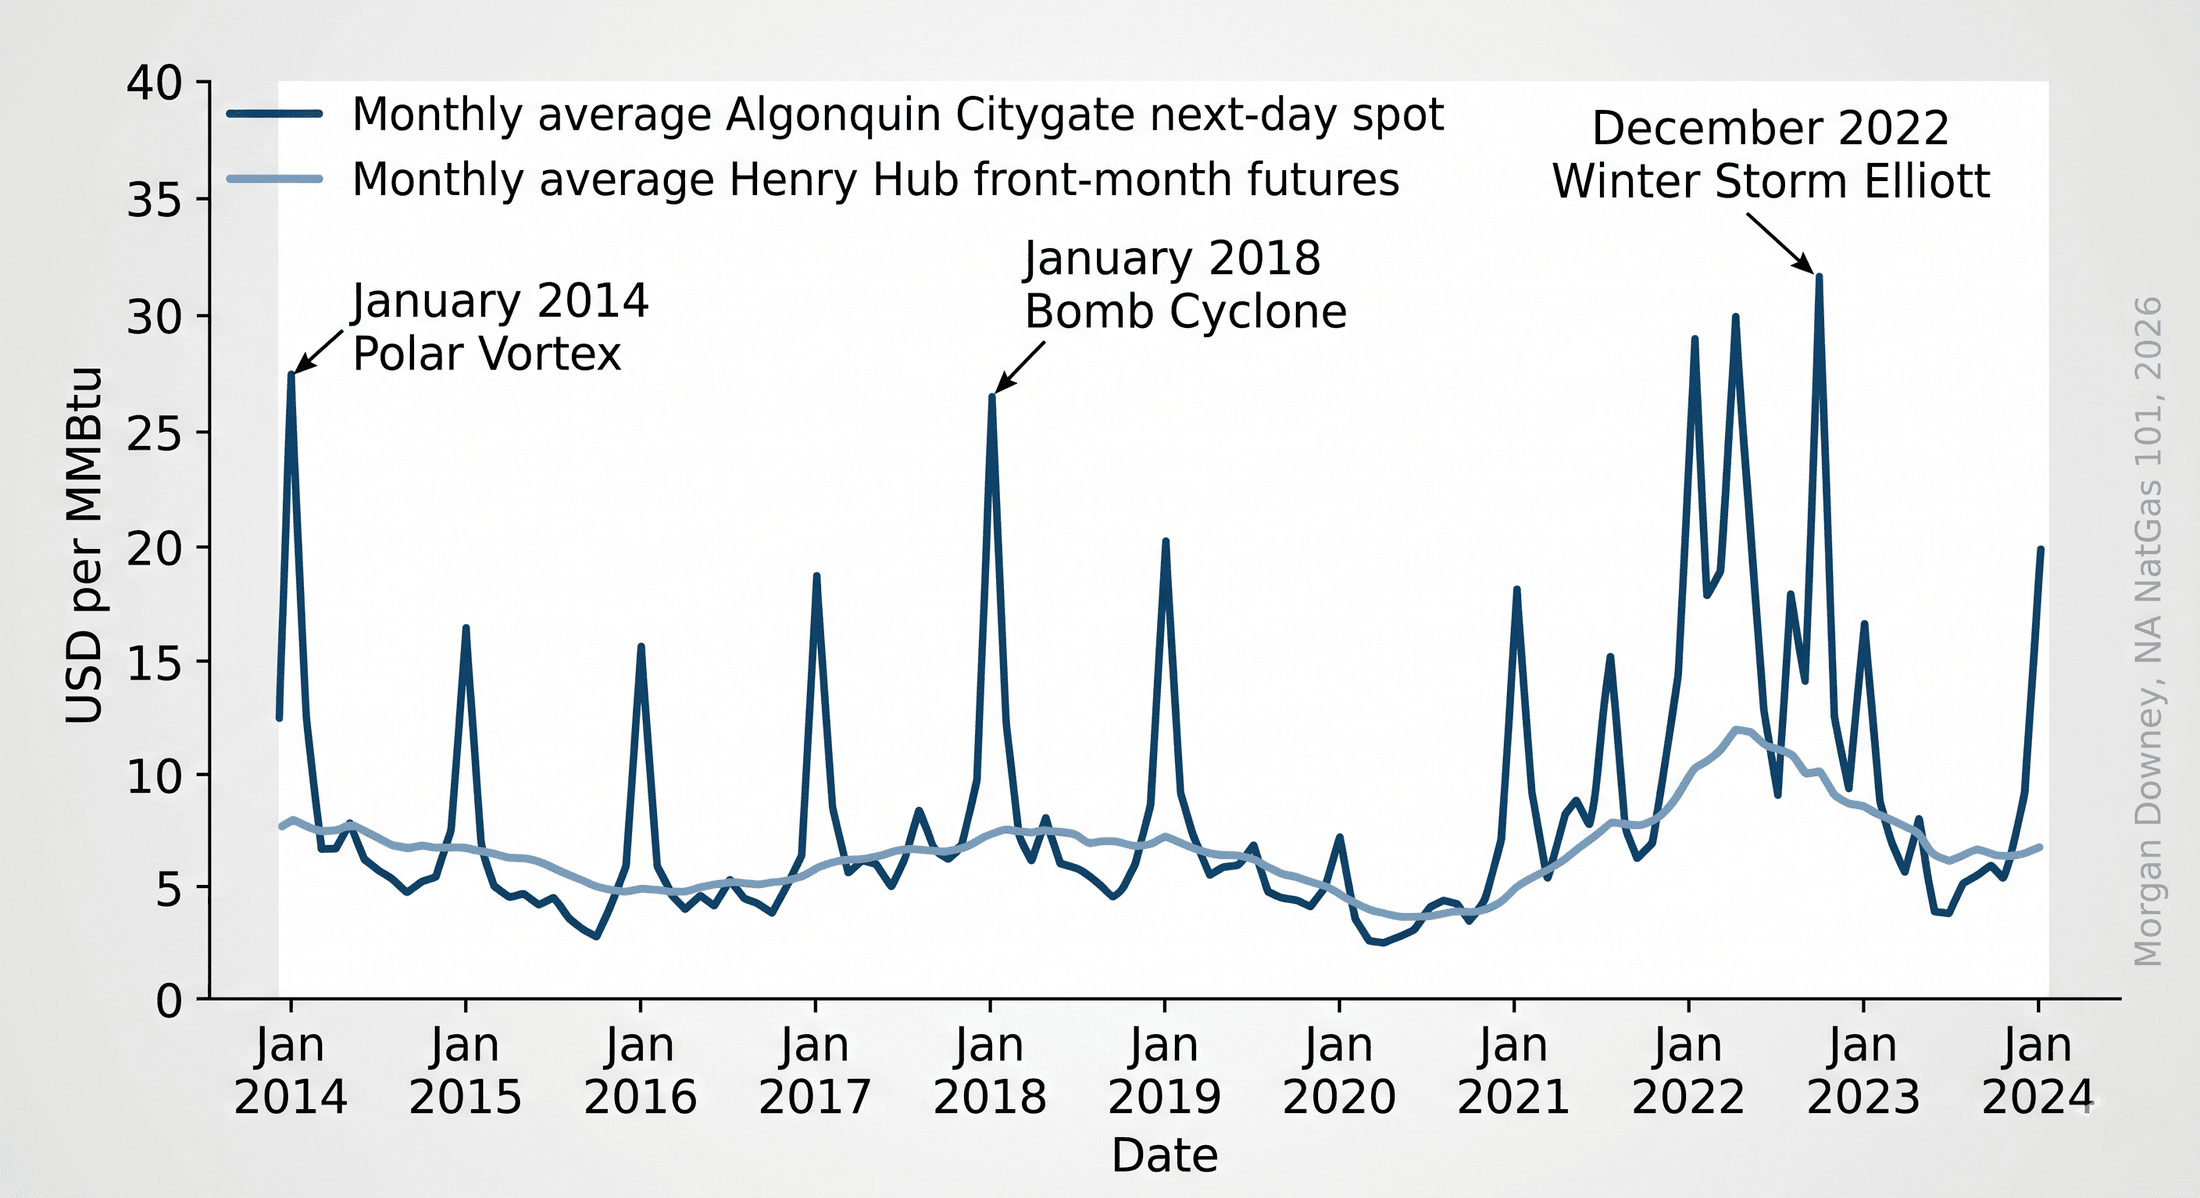
The structural tightness in the Northeast pipeline grid that drives the recurring Algonquin Citygate and Tennessee Zone 6 winter premiums is partly the consequence of this post-2014 wave of canceled pipeline projects. The Marcellus producing region is 200 miles west of the New England demand region. The gas is available at the Pennsylvania border and is unavailable at the Massachusetts city gate on the coldest days of the year. The basis premium that Boston pays in January is the toll the market charges for the takeaway capacity the regulatory and political process has not allowed to be built.
The Bomb Cyclone of January 2018
On Thu Jan 4, 2018, a rapidly deepening winter storm tracked north along the Atlantic seaboard and pulled Arctic air over New England in its wake. Heating demand surged across Boston, Hartford, and Providence. At the Algonquin Citygate, the delivery point that prices gas into eastern Massachusetts and Rhode Island, the spot index for next-day delivery on Fri Jan 5, 2018 settled at $83.85 per MMBtu. The Henry Hub front-month traded under $3 the same day. The basis blew out by a factor of more than 25.
The structural cause was takeaway scarcity. Repeated attempts to expand Algonquin’s capacity (the Access Northeast project, the Atlantic Bridge expansion) had been partially built or canceled in the face of state regulatory opposition in Massachusetts and Rhode Island. The Northeast Energy Direct project on Tennessee Gas Pipeline had been canceled in 2016. New England’s pipeline import capacity in January 2018 was structurally short for a peak winter day.
The most visible consequence was that the LNG tanker Gaselys, chartered by the French utility Engie, arrived at the Distrigas terminal in Everett, Massachusetts on Sun Jan 28, 2018 with a cargo that had originated at the Yamal LNG project in the Russian Arctic. A pipeline-rich country was buying spot LNG from a sanctioned Russian export project to meet its own winter peak. The molecules were available 200 miles to the west at the Pennsylvania border. The pipeline capacity to move them was not.
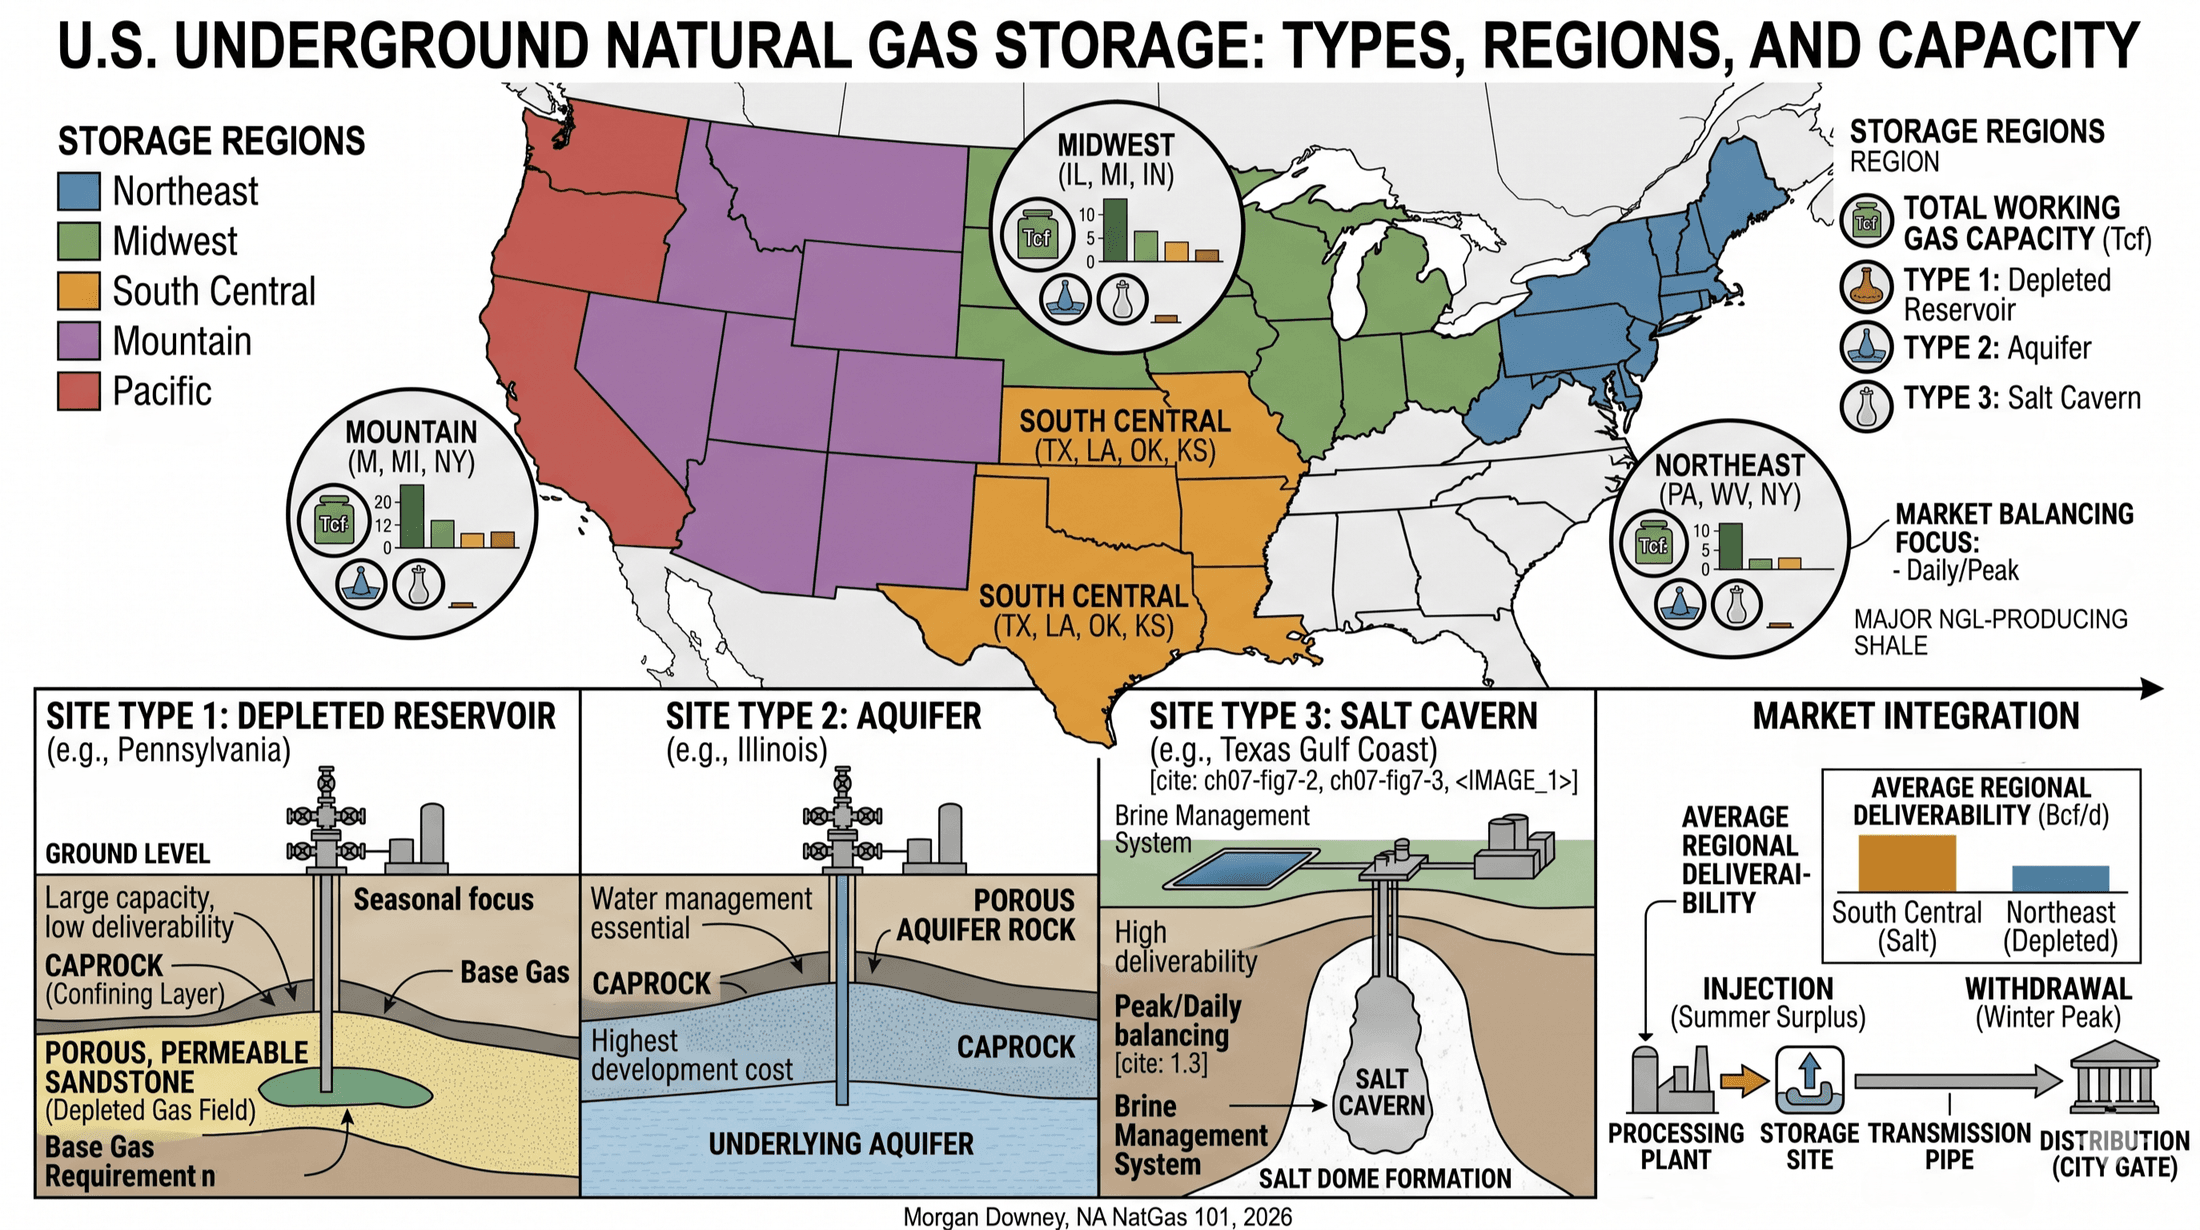
The pipeline grid moves the gas. The salt caverns and depleted reservoirs that absorb the seasonal mismatch between summer production and winter demand are the subject of Chapter 11.