Power Generation
Combined cycle gas turbines, the spark spread, gas as the marginal generator, AI data center demand, and the relationship between gas prices and the electrical grid.
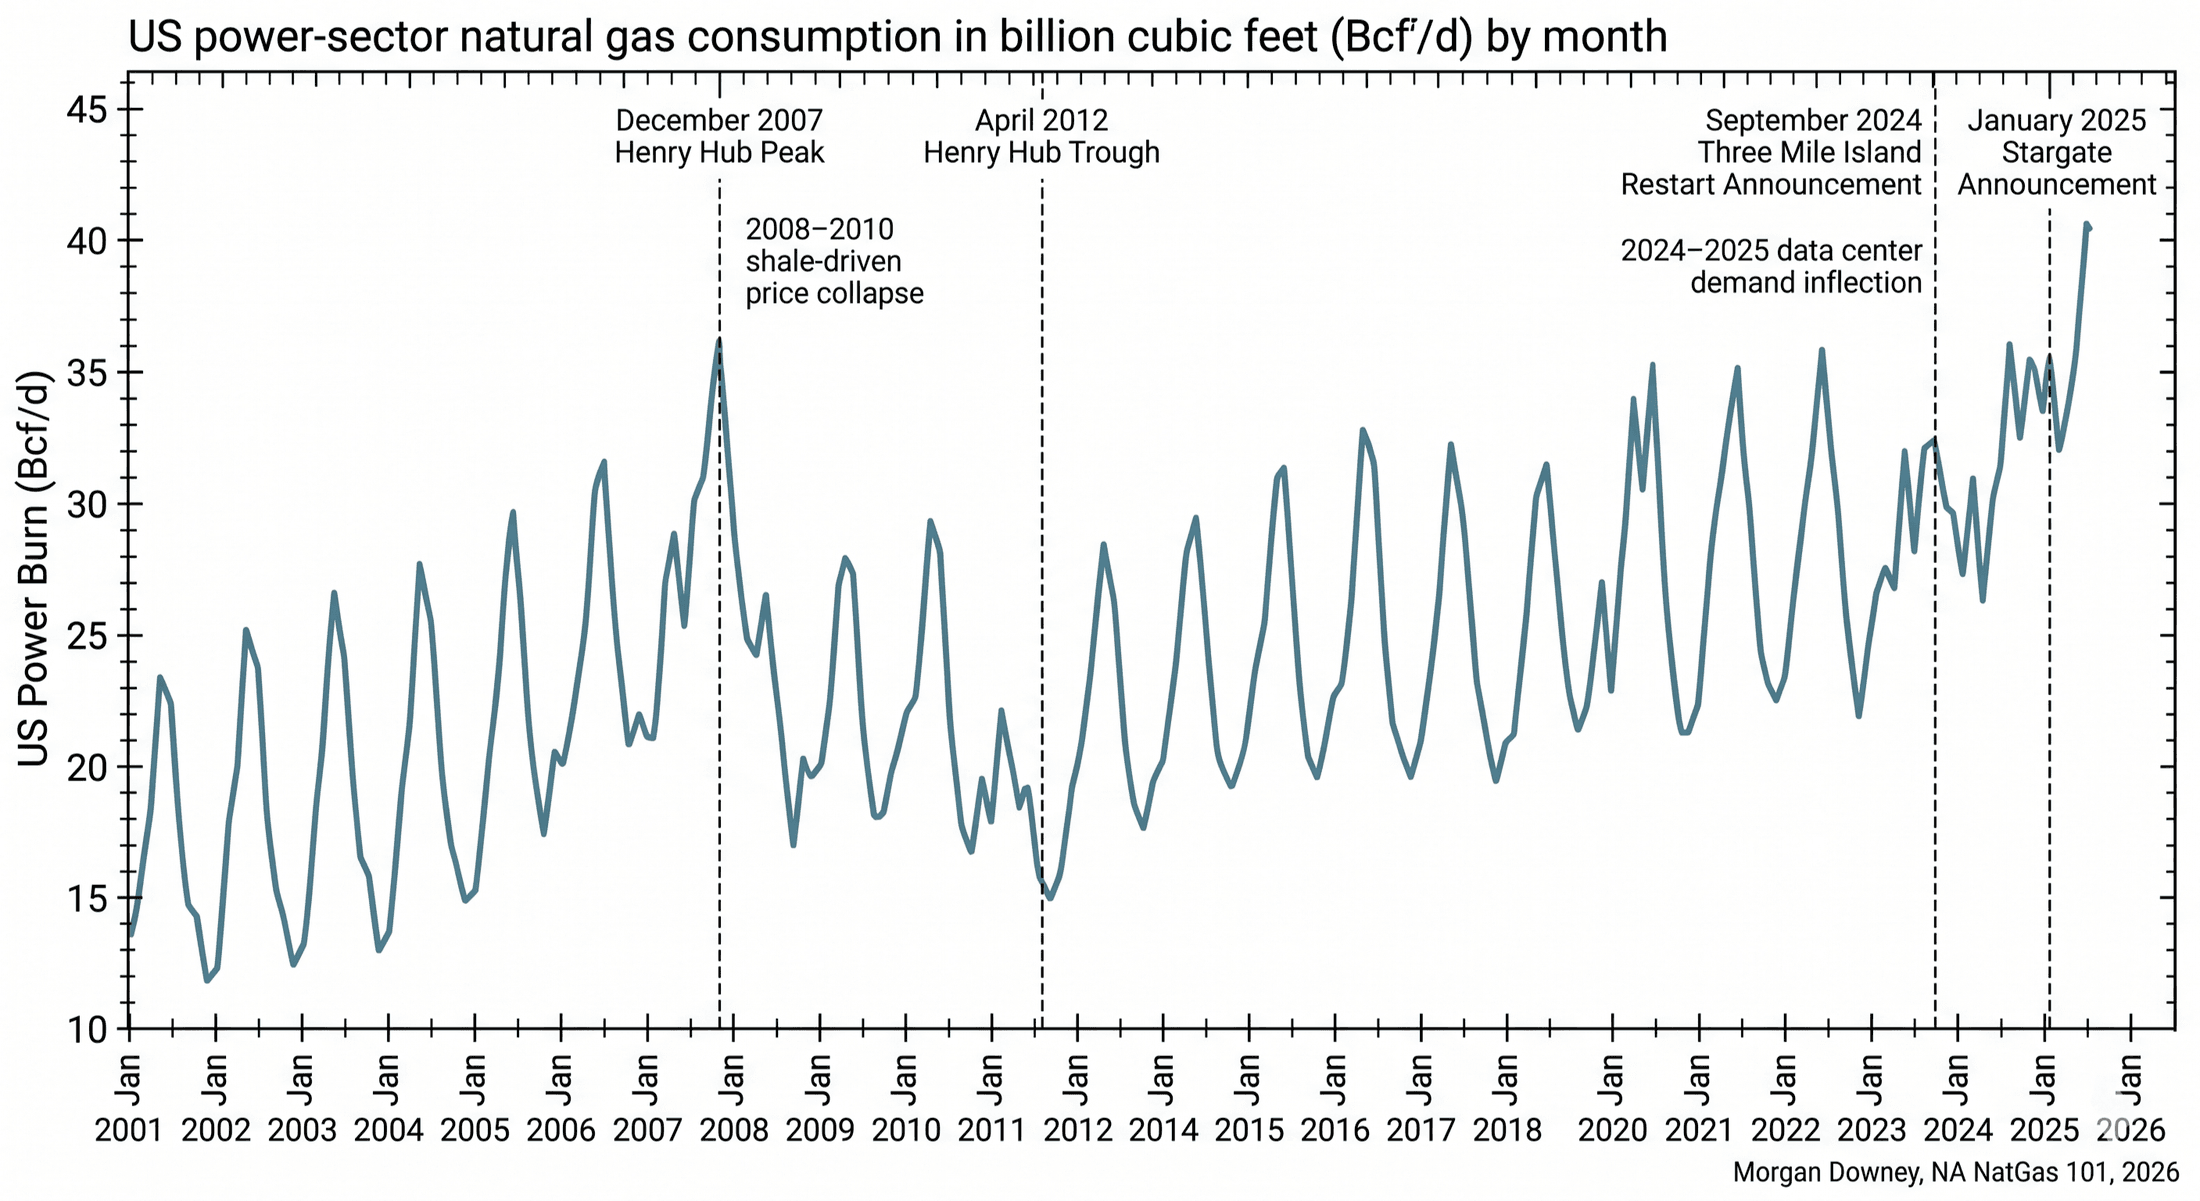
On Fri Sept 20, 2024, Constellation Energy and Microsoft announced a 20-year power purchase agreement under which Constellation would restart Three Mile Island Unit 1, the 837-megawatt pressurized water reactor that had been shut down on the same calendar day five years earlier on the basis that it could not compete with the variable cost of gas-fired generation in PJM. The reactor would be rebranded the Crane Clean Energy Center and was targeted for 2028 in-service. Microsoft’s data center fleet in the PJM footprint would be the offtaker. Four months later, on Tue Jan 21, 2025, OpenAI, SoftBank, Oracle, and MGX announced the Stargate joint venture, $500 billion in committed US data center investment over four years, with the first $100 billion targeted for 2025 and the first cluster siting decisions for Abilene, Texas.
Both announcements landed in a power market that had not built meaningful new gas-fired baseload capacity in more than a decade. ERCOT’s 2024 Capacity, Demand, and Reserves report had projected 2030 peak demand at roughly 130 GW, against a 2023 projection of approximately 85 GW. PJM’s 2024 capacity auction had cleared at $269.92 per MW-day for the 2025/26 delivery year, against $28.92 per MW-day for the prior year. Gas-turbine manufacturers reported 18-to-36-month wait times on H-class units. The first H-class CCGT a hyperscaler ordered in early 2025 would not produce a megawatt-hour before mid-2027.
The chapter that follows is the engineering, the market structure, and the demand inflection that has put the gas-fired generation fleet at the center of the US energy buildout for the rest of the 2020s.
Why Gas Became the Marginal Generator
The structural transition from coal-and-nuclear baseload to gas-as-marginal happened over the 2008-to-2024 period. Three drivers ran in parallel.
The shale gas revolution drove Henry Hub from above $8 per MMBtu in mid-2008 to under $4 for most of the post-2010 period. The collapse moved the variable cost of an F-class CCGT below the variable cost of most of the US coal fleet, and below the variable cost of a meaningful share of the older subcritical coal units in particular. The economic dispatch order, which stacks generators in ascending order of marginal cost, reordered around the new fuel price.
The EPA’s Mercury and Air Toxics Standards, finalized in February 2012 and effective for existing units in April 2015, required coal-fired plants to install activated-carbon injection, dry sorbent injection, or wet flue-gas desulfurization to control mercury and acid-gas emissions. The Cross-State Air Pollution Rule, finalized in August 2011 and effective in 2015 after a D.C. Circuit vacatur was reversed by the Supreme Court in April 2014, capped sulfur dioxide and nitrogen oxide emissions at the state level and forced cross-state allowance trading. Together the two rules forced multi-hundred-million-dollar capital expenditures on legacy coal units that, given the new fuel price gap, did not pencil. Operators retired the units rather than retrofit them.
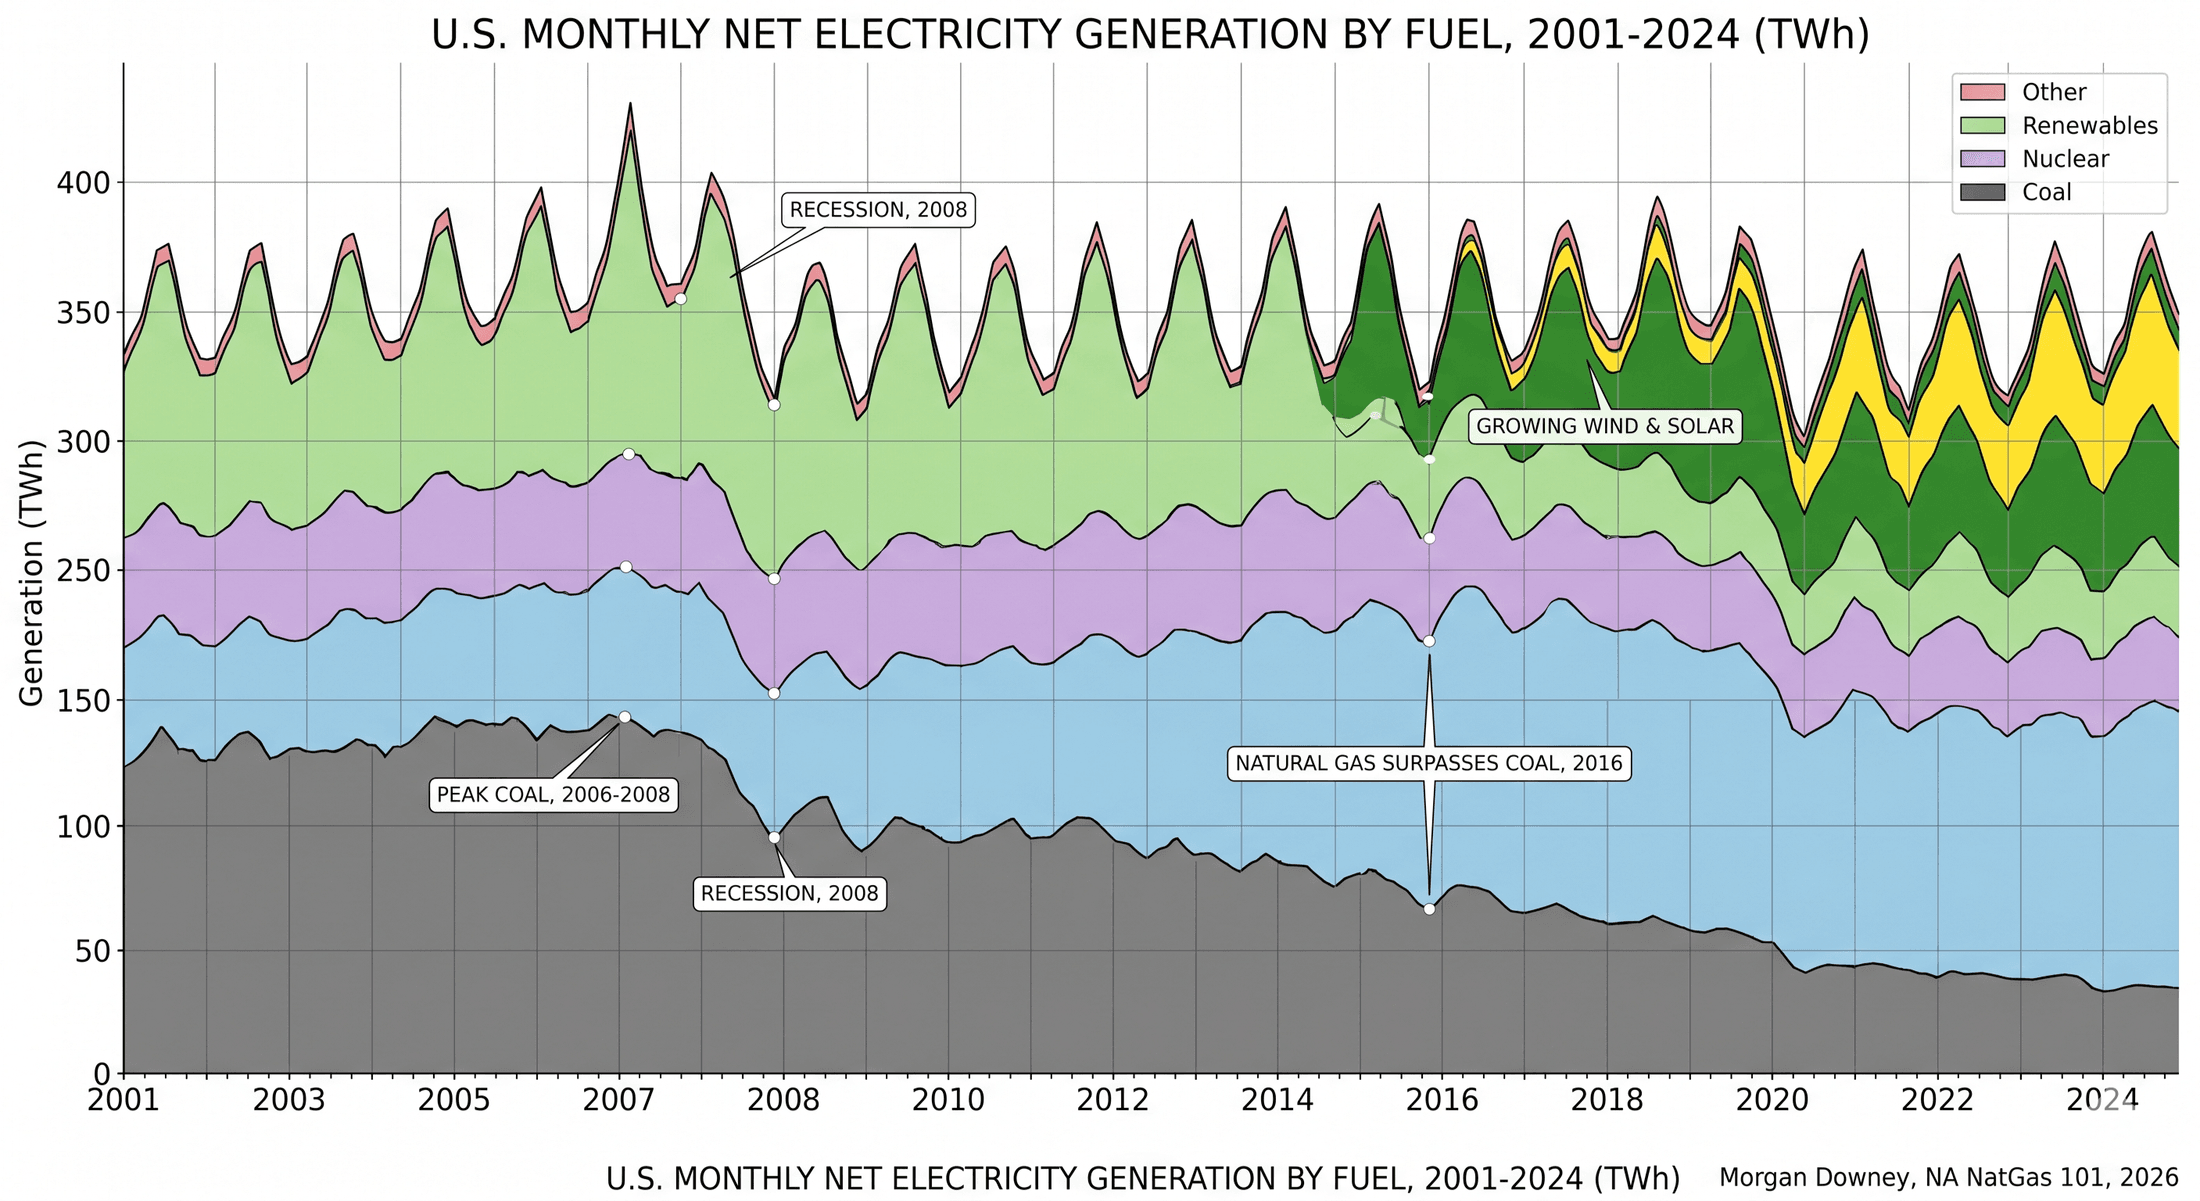
Wind and solar’s growing share displaced coal from the marginal-dispatch position even when gas was not directly cheaper. As wind and solar bid into the day-ahead market at near-zero variable cost, the residual load left for fuel-fired generation contracted, and the fuel-fired units that remained dispatched at their marginal cost. The flexible CCGTs followed the residual load up and down through the day; the inflexible coal plants, which require hours to ramp and which suffer accelerated wear when cycled, were the first units idled and the last units restarted. The economic erosion compounded the regulatory and fuel-price pressure.
The result is visible in the EIA’s electric power data. US coal-fired generation peaked at roughly 2,000 TWh in 2007 at approximately 50 percent of total US generation. By 2024, coal had fallen below 700 TWh at under 17 percent share. Gas-fired generation rose from roughly 900 TWh in 2008 to over 1,800 TWh in 2024, passing coal in 2016 and remaining the largest single source of US electricity ever since. Roughly 40 to 45 percent of US electricity in 2024 came from gas-fired generation. Gas became the marginal generator on most US grids most hours of most days.
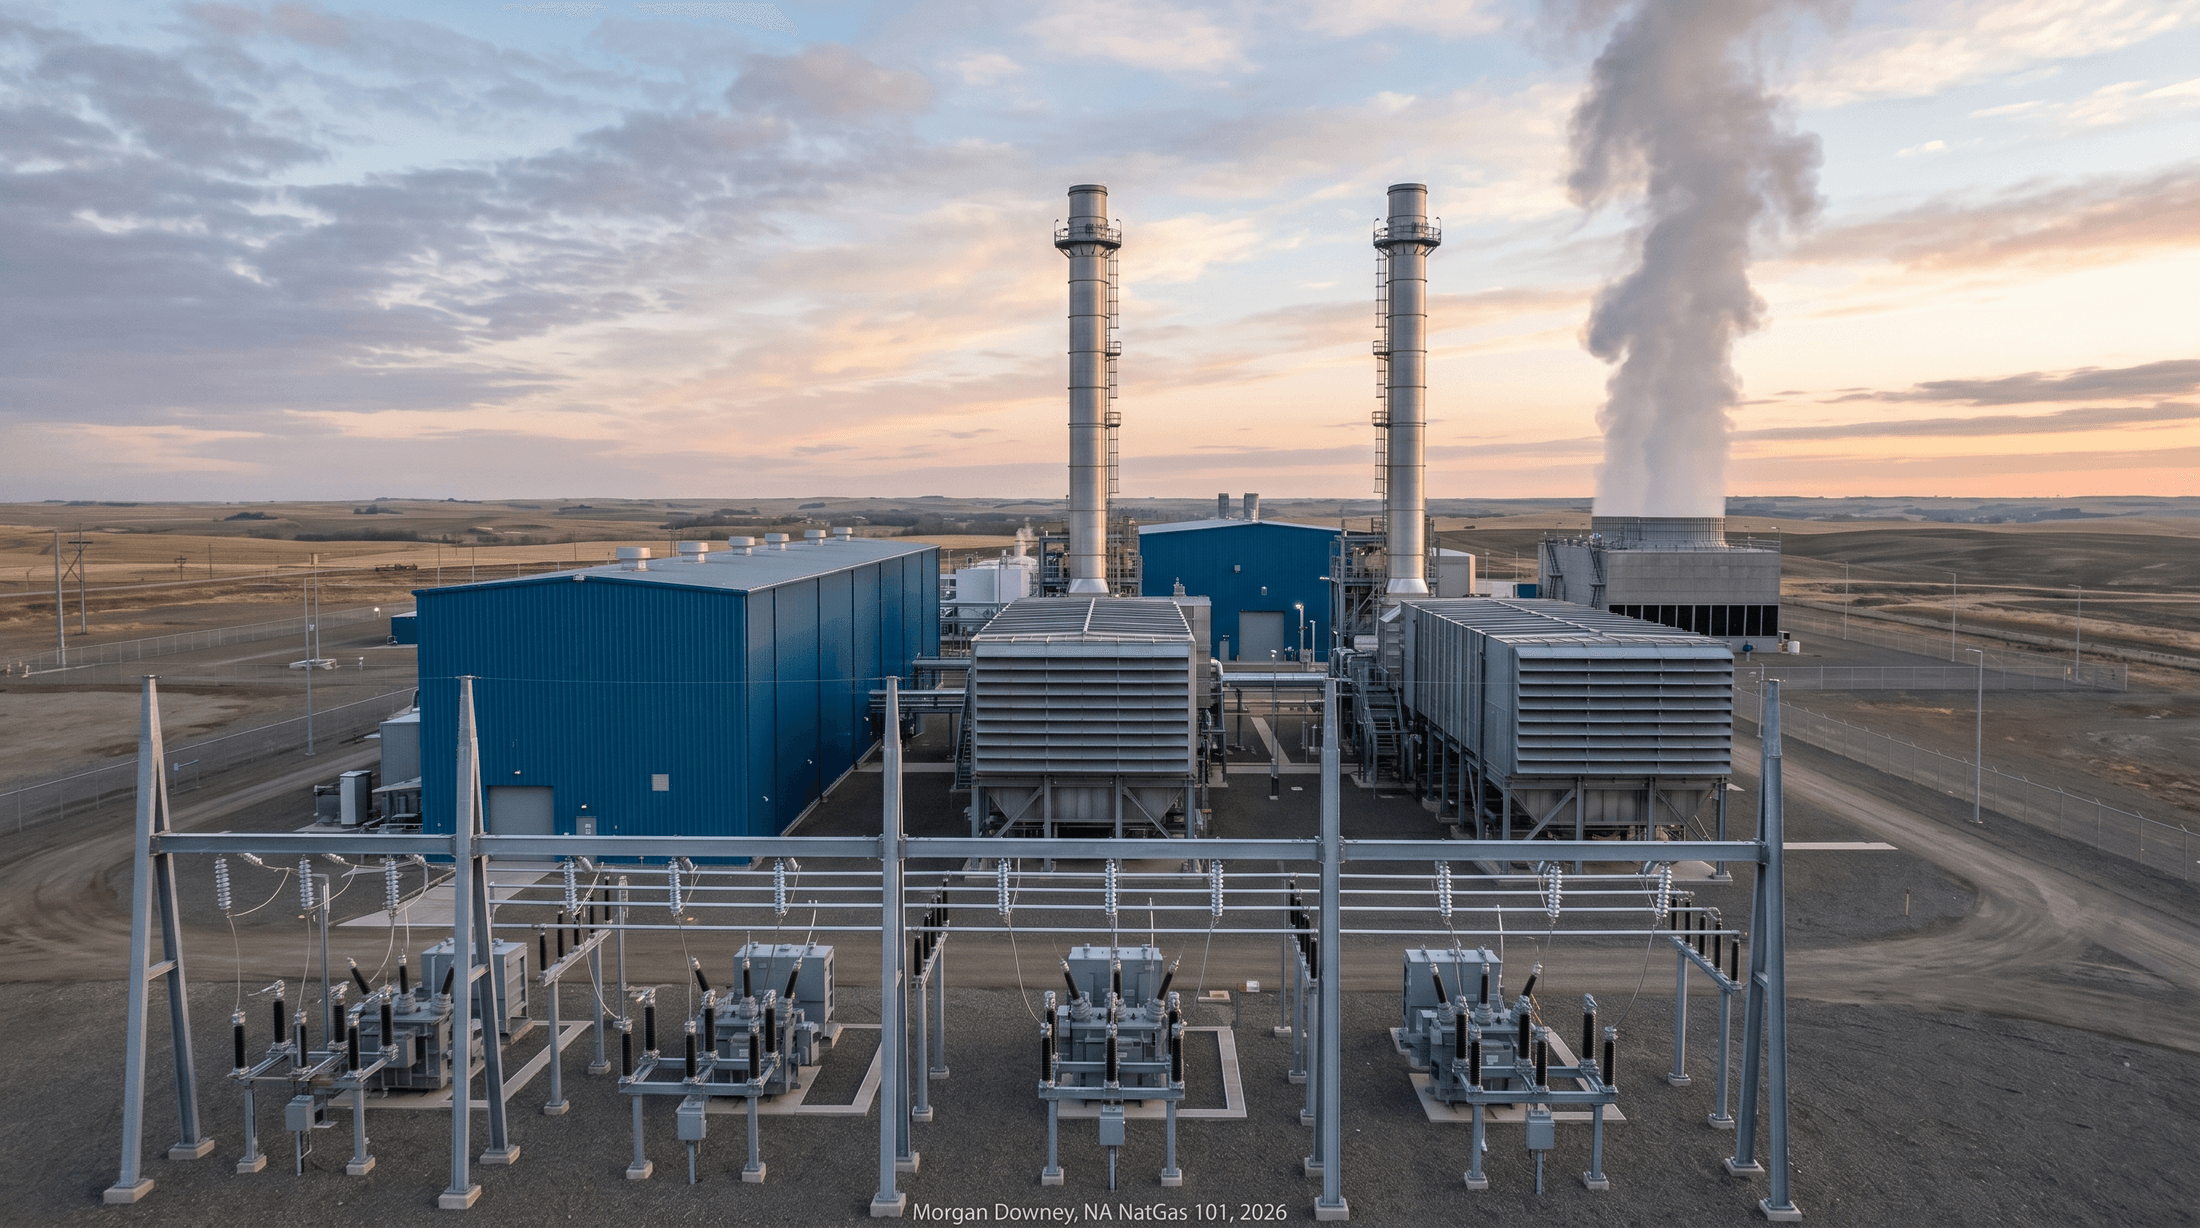
The Combined-Cycle Gas Turbine
The combined-cycle gas turbine is the workhorse of modern gas-fired generation. The cycle is a Brayton-cycle gas turbine on top of a Rankine-cycle steam turbine, sharing a single fuel-to-electricity power train.
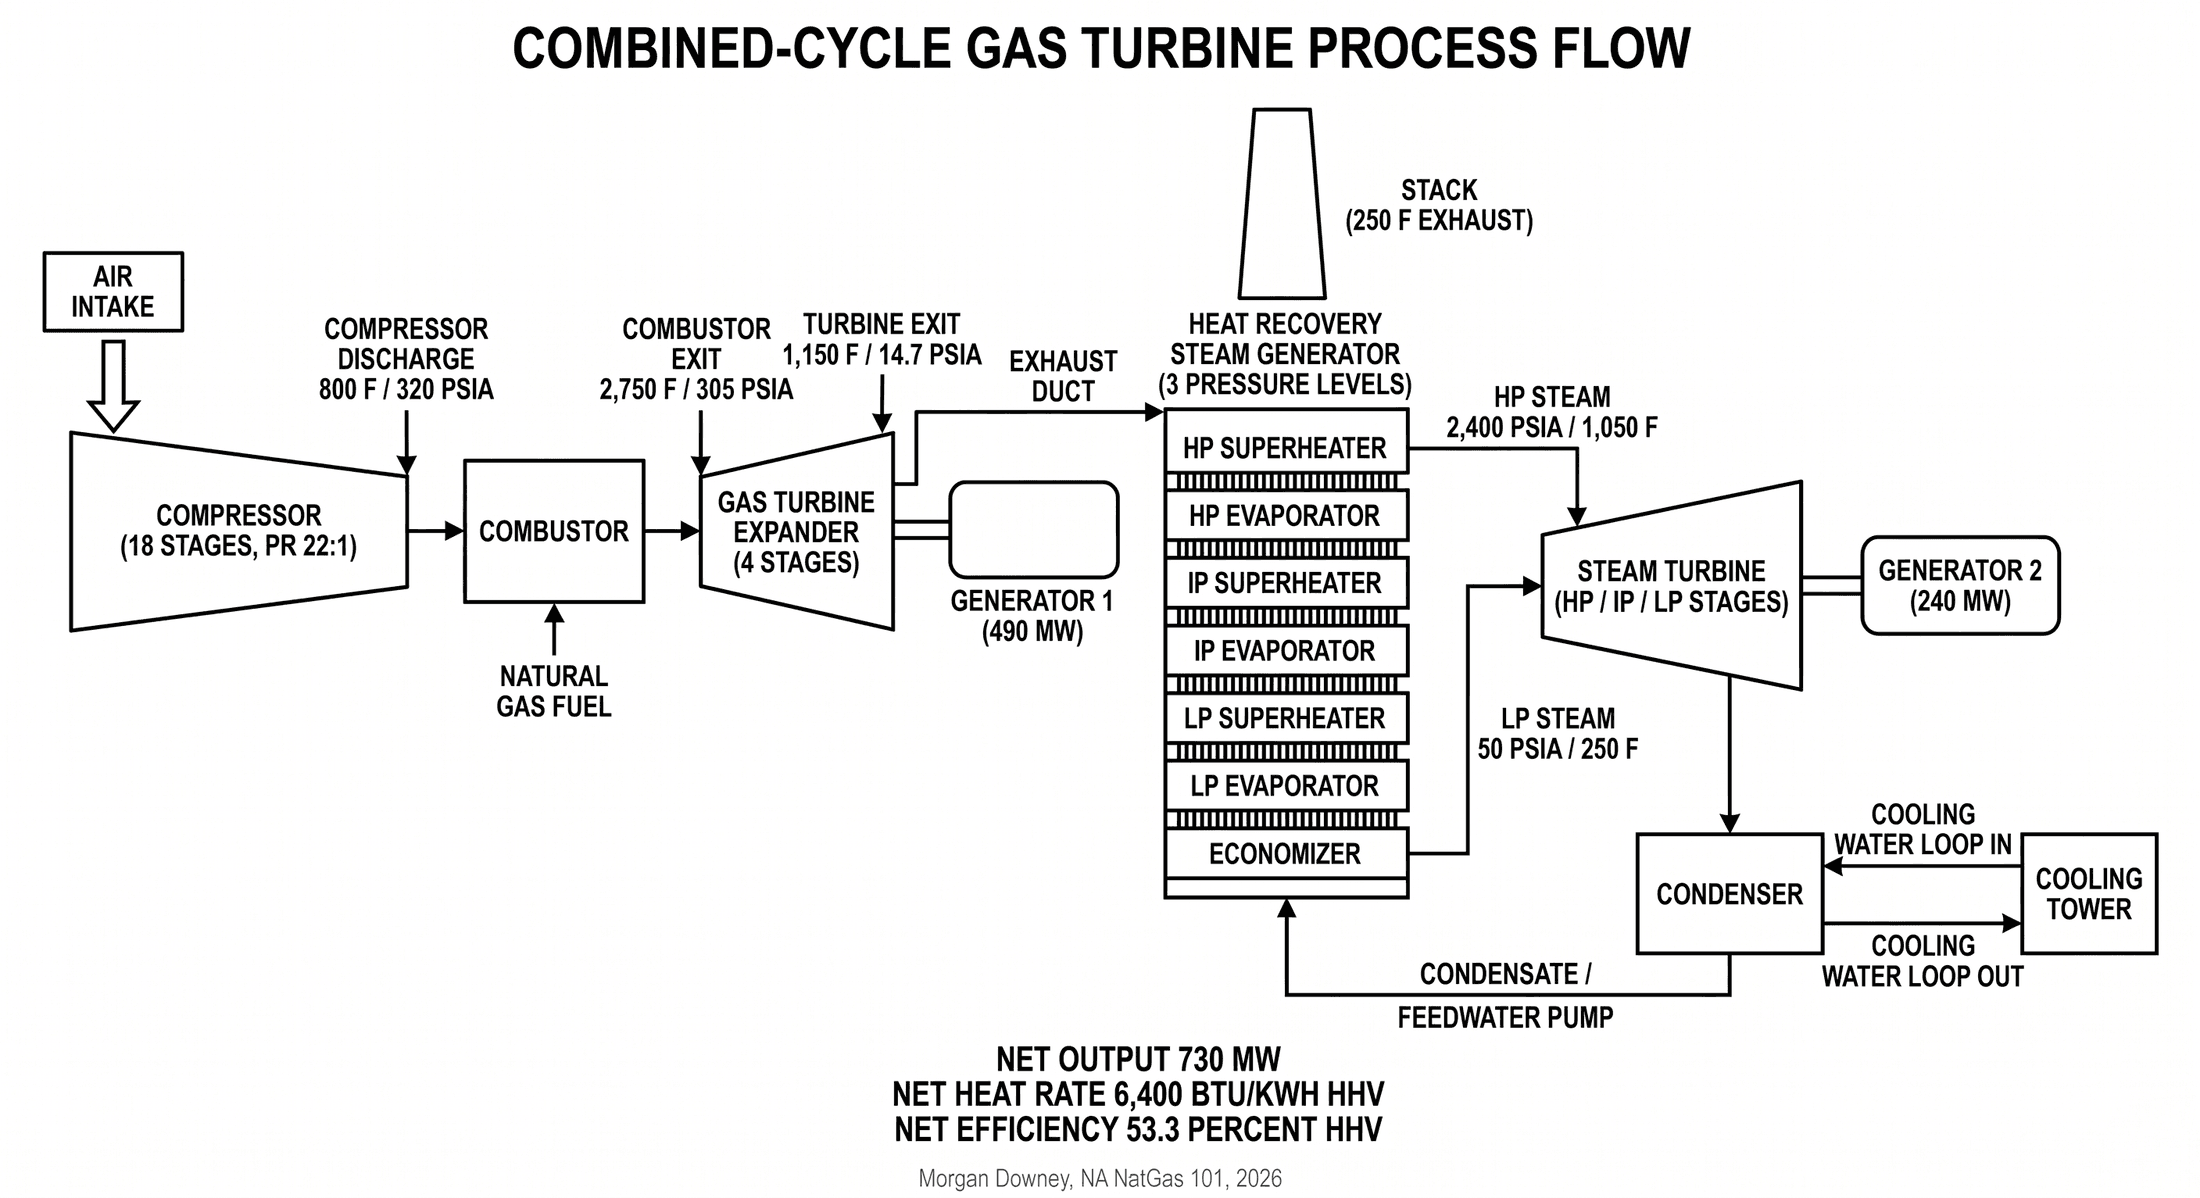
The gas turbine is itself a complete prime mover. Atmospheric air is drawn into a multi-stage axial compressor and pressurized to 18 to 25 atmospheres. The compressed air enters an array of combustor cans (or, in the most modern units, an annular combustor) where pipeline-quality natural gas is injected and ignited. The combustion gas leaves the combustor at 2,500 to 2,800 degrees Fahrenheit and 17 to 23 atmospheres, then expands across a four-stage axial turbine that drives the compressor on the front of the same shaft and a generator on the back. The gas turbine produces roughly two-thirds of the plant’s net electrical output. The exhaust gas leaving the turbine is still hot, in the range of 1,000 to 1,200 degrees Fahrenheit, and at near-atmospheric pressure.
The exhaust feeds a heat recovery steam generator, the HRSG. The HRSG is a finned-tube heat exchanger arranged at multiple pressure levels, typically high-pressure (2,000 psig and above), intermediate-pressure (400 to 600 psig), and low-pressure (50 to 100 psig). Boiler feedwater enters the lowest-pressure economizer, is preheated by the cooler exhaust gas at the back of the HRSG, then steps through evaporators and superheaters at successively higher pressures. Steam exits the HRSG at design conditions matched to the steam turbine inlet (typically 1,800 to 2,400 psig, 1,000 to 1,050 degrees Fahrenheit). A modern triple-pressure reheat HRSG recovers roughly 90 percent of the recoverable energy in the gas turbine exhaust.
The steam turbine is a multi-stage axial-flow machine in three sections (high-pressure, intermediate-pressure, and low-pressure) that drives a second generator. In a single-shaft configuration, the steam turbine sits on the same shaft as the gas turbine and shares one generator. In a multi-shaft configuration, the steam turbine has its own generator on a separate shaft. The steam exits the low-pressure section into a condenser, where it gives up its latent heat to a cooling water loop and returns to the boiler feedwater system as condensate. The cooling water side is fed by either an air-cooled condenser (mostly in arid Western US sites), a wet cooling tower (the most common US configuration), or a once-through water source (older plants on rivers or coastlines, increasingly restricted by EPA Clean Water Act Section 316(b) cooling-water intake regulation).
The composite gives the CCGT its defining efficiency. Fuel-to-electricity conversion runs 55 to 65 percent at full load on a higher-heating-value basis, against 33 to 38 percent for a comparable subcritical or supercritical coal-fired plant and 35 to 40 percent for a single-cycle gas turbine.
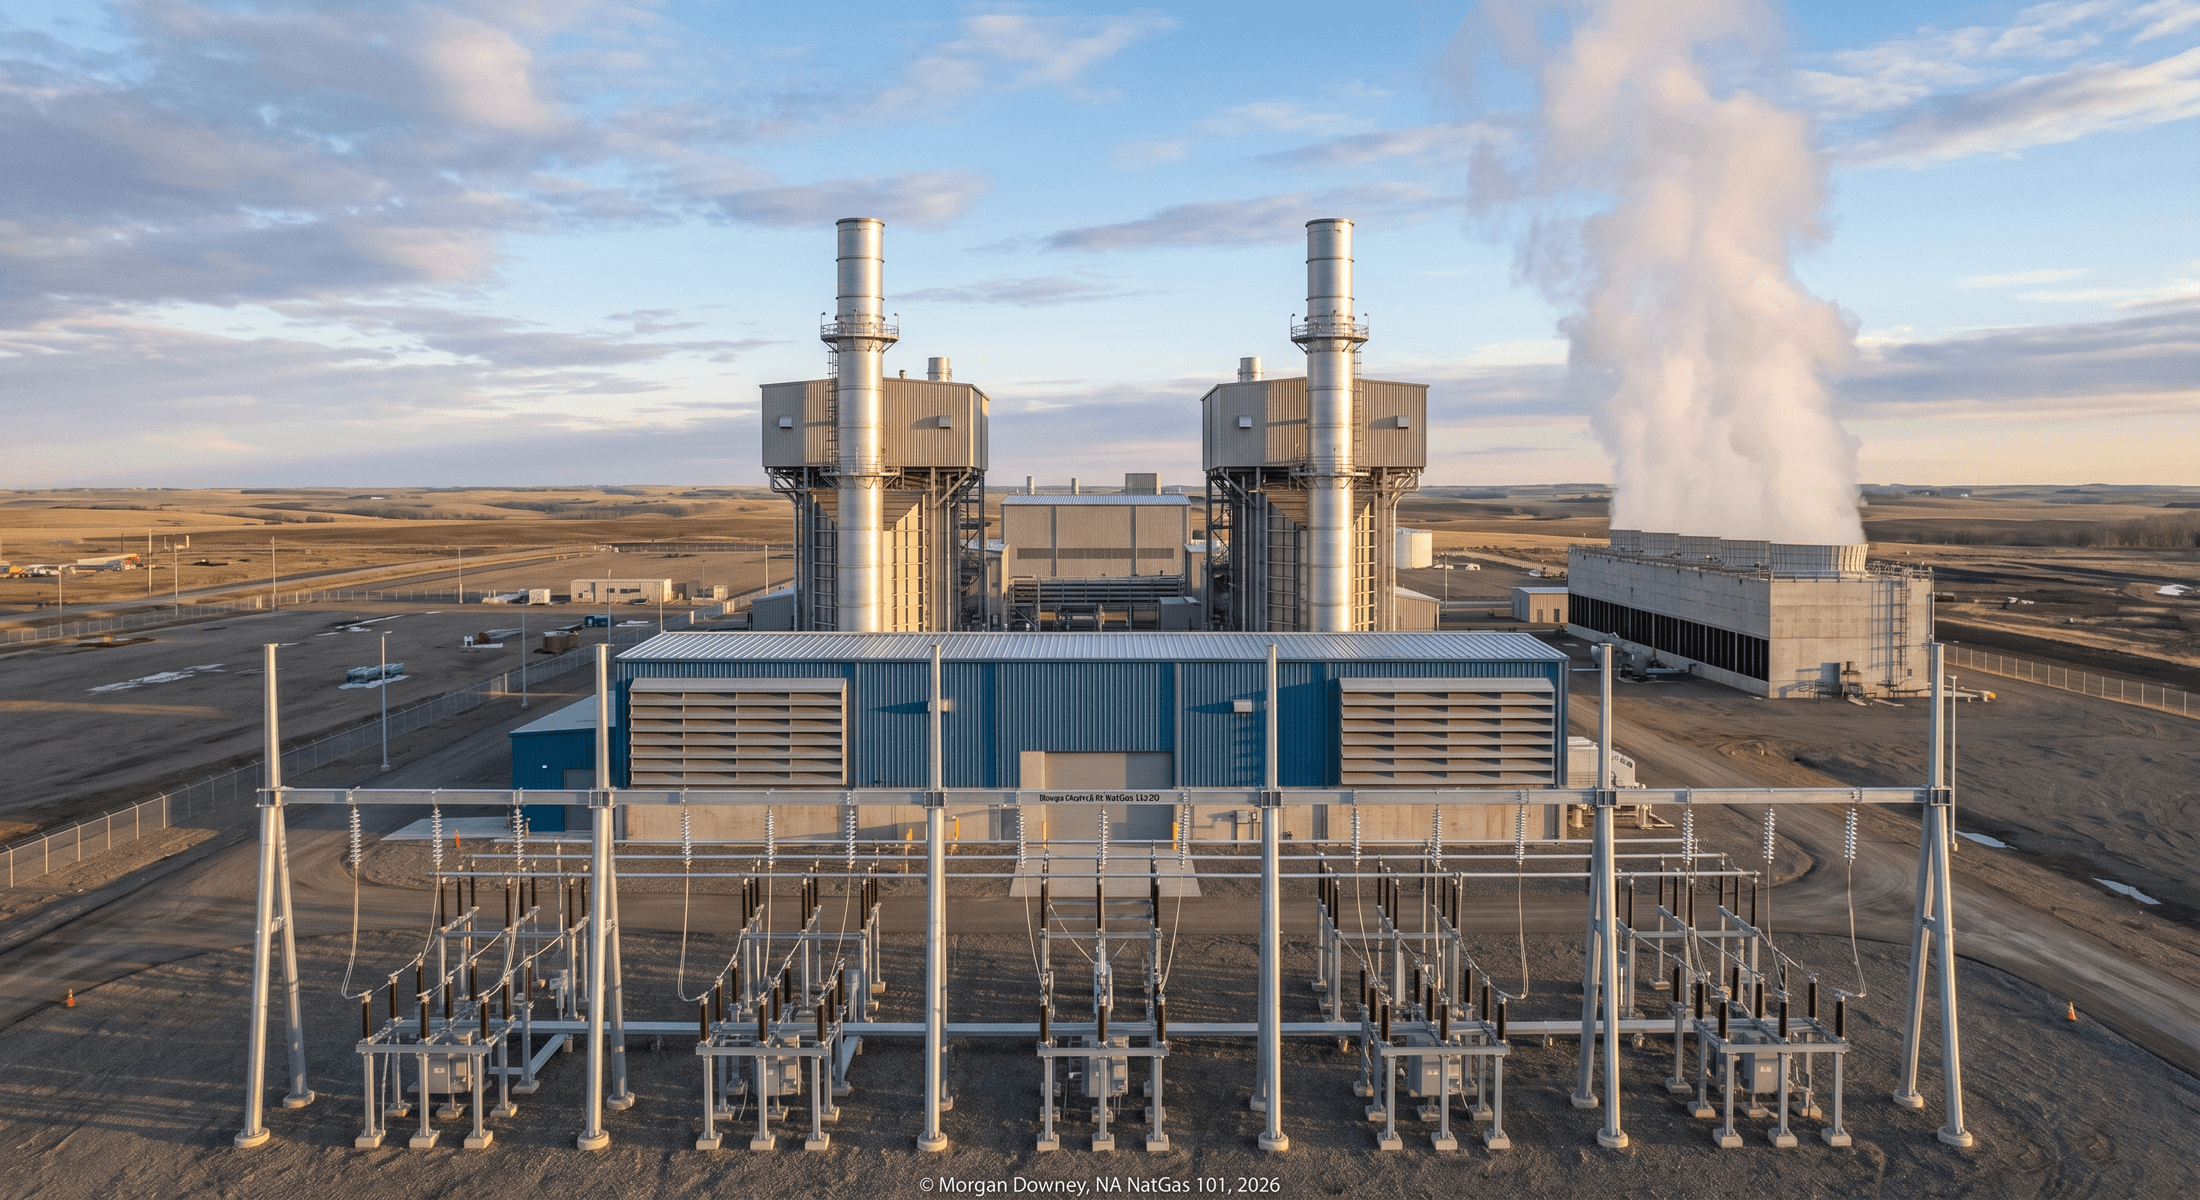
Four manufacturers cover the modern US CCGT market. GE Vernova (the GE Power business spun off from General Electric on Tue Apr 2, 2024) supplies the 7HA series in 60-Hz markets and the 9HA series in 50-Hz markets. The 7HA.03 produces approximately 430 MW in simple cycle and approximately 730 MW in a 1-on-1 combined cycle configuration. Siemens Energy (the Siemens spin-off completed in September 2020) supplies the SGT6-9000HL in 60-Hz markets and the SGT5-9000HL in 50-Hz markets, each rated at approximately 470 MW in simple cycle. Mitsubishi Power (the Mitsubishi Heavy Industries gas turbine business, formerly Mitsubishi Hitachi Power Systems through the 2014 joint venture and the 2021 dissolution) supplies the M501JAC in 60-Hz and the M701JAC in 50-Hz, each rated at approximately 470 MW in simple cycle. Ansaldo Energia supplies the GT26 and GT36 in limited US installation; the GT36 is rated at approximately 538 MW in simple cycle. A typical modern 1x1x1 plant (one gas turbine, one HRSG, one steam turbine) outputs 350 to 600 MW. A 2x2x1 plant (two gas turbines, two HRSGs, one steam turbine) outputs 700 to 1,200 MW. A handful of merchant operators have built 3x3x1 plants at 1.5 GW or larger.
Heat Rate, Spark Spread, and Merchant Economics
Heat rate is the inverse efficiency: Btu of fuel input per kWh of electricity output. The unit is awkward (3,412 Btu per kWh is the dimensional floor of 100 percent efficiency) but every merchant generator’s bid stack is built on it.
A modern H-class CCGT runs at 6,200 to 6,800 Btu per kWh on a higher-heating-value basis at full load, equivalent to 53 to 56 percent net thermal efficiency. An older F-class CCGT (the GE 7FA, the Siemens SGT6-5000F, the Mitsubishi M501F, all installed in volume during the 2000s) runs at 7,000 to 7,500 Btu per kWh, equivalent to 48 to 51 percent. A simple-cycle gas turbine peaker, built without a steam bottoming cycle to start fast and run intermittently, runs at 9,500 to 11,500 Btu per kWh. The peaker sacrifices fuel efficiency for fast-starting peaking duty.
The spark spread is the merchant-generator margin, expressed in dollars per MWh of electricity sold. The arithmetic is direct. Power price (in $/MWh) minus heat rate (in Btu/kWh) times gas price (in $/MMBtu, divided by 1,000 to convert MMBtu to MBtu, multiplied by kWh per MWh to align units) minus variable operations and maintenance (typically $2 to $5 per MWh on an H-class unit). At Henry Hub $3.50 per MMBtu and a 7,000 Btu/kWh F-class CCGT, the fuel cost is $24.50 per MWh. At PJM Western Hub day-ahead $50 per MWh, the spark spread before variable O&M is $25.50 per MWh. After $3 per MWh of variable O&M the spark spread is $22.50 per MWh. An H-class unit at the same gas price and same power price would burn $22.40 per MWh of fuel and earn $24.60 per MWh after $3 of variable O&M. A simple-cycle peaker at 11,000 Btu/kWh would burn $38.50 per MWh of fuel and would not be in the money to dispatch at all, which is the point of a peaker: it sits idle except when system load drives the locational marginal price above its high heat-rate floor.
The dark spread is the equivalent merchant margin for a coal-fired generator. With Powder River Basin coal at $15 per ton at the mine and an 11,000 Btu/lb heating value, the delivered fuel cost on a 9,500 Btu/kWh subcritical coal plant works out to roughly $13 per MWh before transport and emissions costs. After rail transport (typically $10 to $20 per ton in 2020s prices) and CO2 allowance costs (in regions with binding cap-and-trade programs), the dark spread has been negative across most US grids for most of the post-2010 period. The dispatch order followed the spread.
Capacity payments layer on top of energy market revenues in the seven RTO and ISO footprints that operate capacity markets. PJM’s Reliability Pricing Model holds an annual Base Residual Auction three years ahead of the delivery year, clearing a fixed quantity of capacity at a single zonal price. ISO-NE runs a Forward Capacity Market on a similar three-year-forward basis. NYISO runs an Installed Capacity Market on six-month strip auctions. MISO runs a Planning Resource Auction with a one-year-forward delivery basis. ERCOT operates without a capacity market, relying on energy and ancillary services revenue alone (the energy-only design covered below). For an H-class CCGT in PJM, the 2025/26 capacity clearing price of $269.92 per MW-day translates to roughly $98,000 per MW-year, or $9.80 per MWh of revenue at a 100 percent capacity factor (and proportionally more at lower capacity factors when allocated across actual energy delivered). At the prior year’s clearing of $28.92 per MW-day, the same translation yielded $10,500 per MW-year, or $1.05 per MWh at 100 percent capacity factor. The capacity revenue moved by roughly an order of magnitude in a single auction cycle. The merchant business model depends on the spark spread and the capacity clear holding through the asset’s operating life.
The ISO/RTO Landscape
US power markets are organized into seven independent system operator and regional transmission organization footprints that operate centralized day-ahead and real-time energy markets, capacity or resource adequacy markets, and ancillary service markets. Each footprint dispatches its connected generation fleet against forecast and real-time load, settles the resulting energy and reserves at locational marginal prices, and maintains transmission reliability at the bulk power system level.
PJM Interconnection is the largest, covering all or part of Pennsylvania, New Jersey, Maryland, Delaware, Virginia, West Virginia, Ohio, Indiana, Illinois, Kentucky, Tennessee, North Carolina, Michigan, and the District of Columbia. PJM operates the day-ahead and real-time energy markets, the Reliability Pricing Model capacity market, and the synchronized reserves and regulation markets. MISO (the Midcontinent Independent System Operator) covers Michigan, Wisconsin, Minnesota, Iowa, Missouri, Arkansas, Mississippi, Louisiana, Indiana, Illinois, and parts of the Dakotas, Montana, and Texas, with a three-zone resource adequacy structure. ERCOT (the Electric Reliability Council of Texas) covers most of Texas as a discrete interconnection electrically separated from the Eastern and Western Interconnections, operates an energy-only market with no capacity payment, and maintains the operating reserve demand curve as a scarcity-pricing mechanism. CAISO (the California Independent System Operator) covers most of California and a small portion of Nevada, operates day-ahead and real-time energy markets, runs the Resource Adequacy program as the capacity-accreditation mechanism, and operates the Western Energy Imbalance Market across most of the Western Interconnection. NYISO covers New York State and runs the Installed Capacity Market. ISO-NE covers the six New England states and runs the Forward Capacity Market. SPP (the Southwest Power Pool) covers Kansas, Oklahoma, Nebraska, parts of Texas and New Mexico, and parts of the Dakotas, Iowa, Missouri, Montana, and Wyoming, and operates an Integrated Marketplace.
The non-RTO regions of the United States (the Southeast outside PJM, the Pacific Northwest, much of the Mountain West) operate as bilateral markets organized around vertically integrated utilities. Duke Energy serves the Carolinas and Florida; Southern Company subsidiaries (Georgia Power, Alabama Power, Mississippi Power) serve the Deep South; the Tennessee Valley Authority serves Tennessee and parts of Alabama, Mississippi, Kentucky, Georgia, North Carolina, and Virginia; the Bonneville Power Administration markets federal hydropower across the Pacific Northwest; PacifiCorp, NV Energy, Idaho Power, Arizona Public Service, and the Tucson Electric Power and Salt River Project utilities serve the Mountain West and Desert Southwest. The Western Energy Imbalance Market and the planned Western Resource Adequacy Program have introduced day-ahead and reserve-market integration across the bilateral region without converting any of the constituent utilities to RTO membership.
The dispatch mechanism is the same across the centralized markets. Each ISO clears the day-ahead market by stacking generator offers in ascending order of marginal cost and dispatching the units in that order until forecast demand is met. The marginal generator (the most expensive unit needed to meet demand at a given location, given binding transmission constraints) sets the locational marginal price for that node. Gas-fired generators are the marginal unit during much of the day in most US grids, which is why Henry Hub price and the regional power price move together at near-unity correlation through the bulk of the year. The exception is in the deep peak hours when scarcity pricing engages and the marginal unit is a peaker or an emergency demand response resource priced into the high hundreds or low thousands of dollars per MWh.
The regional design choices matter. ERCOT’s energy-only market produced the Winter Storm Uri price spike of February 2021, when the system operator administratively raised the energy price to the $9,000 per MWh price cap and held it there for 87 of 96 hours from late Sun Feb 14 through Fri Feb 19, 2021. Roughly 4.5 million ERCOT customers lost power at the peak of the curtailment. At least 246 deaths in Texas have been attributed to the storm and its aftermath in subsequent state and federal reviews. Many gas-fired plants lost fuel deliveries when the upstream gas gathering and processing facilities froze and the feeder pipelines could not maintain pressure; some lost power to their own auxiliaries when the local distribution circuit went down. The energy-only market design transferred almost $50 billion of charges to load over five days. The episode rewrote the case for capacity markets in any system facing a similar weather risk.
Cold-Start, Ramp Rates, and Operational Flexibility
Modern CCGTs cold-start in 30 to 60 minutes from a stopped state to full load, with the time depending on the design of the HRSG (single-pressure designs start faster than triple-pressure designs because they have less metal mass to bring to operating temperature) and on the manufacturer’s purge sequence requirements. A hot restart, after the unit has been off line for a few hours but still warm, can be done in 15 to 25 minutes. A simple-cycle peaker can synchronize and reach full load in 8 to 12 minutes. Ramp rates of 30 to 50 MW per minute are typical for an H-class unit at part load, allowing the plant to follow load as wind and solar output varies through the operating day.
The flexibility is structural. Gas-fired generation is the only fuel-fired technology that can ramp at the rate wind and solar variability requires, while continuing to provide synchronous inertia, reactive power, and frequency support to the bulk power system. Nuclear units operate at fixed output through the day. Coal units cycle with multi-hour ramp times and accelerated wear. Hydro and pumped storage are flexible but geographically limited. Battery storage is fast and locationally flexible but operates on a four-to-eight-hour duration and is not a multi-day baseload resource. Among the dispatchable fleet, gas alone fills the load-following role at scale.
As wind and solar share has grown, the gas fleet has shifted from baseload duty (running 24/7 at full output) to load-following duty (cycling output up and down through the day in response to net load on the grid, with daytime troughs as solar output peaks and evening peaks as solar output falls and residential demand rises). The cycling regime accelerates wear on hot-section components, the combustor liners, transition pieces, and first-stage turbine blades that operate near the metallurgical limit during steady-state operation and that suffer thermal-mechanical fatigue with each start-stop cycle. Operators build cycling-related maintenance into the operating plan, with combustor inspections at 8,000 fired hours and major hot-gas-path inspections at 24,000 fired hours on H-class machines, accelerated by a fired-hour-equivalent factor for each start. The ability to ramp is the reason gas remains the marginal-fuel reference even as renewables grow.
The Duck Curve
The shape that the gas fleet now follows through a high-solar day is the duck curve. Total system demand peaks twice on a typical weekday: a smaller morning peak as households wake up and businesses open, and a larger evening peak as residential consumption stacks on top of late-afternoon commercial cooling. Solar generation runs the opposite shape, near zero overnight, climbing through the morning, peaking in the early afternoon, and falling back to zero at sunset. The residual is what fuel-fired generation has to cover. Subtract the solar curve from the demand curve and the result has the silhouette of a duck: a flat tail through the small overnight hours, a rising back as morning load builds, a sagging belly through the midday solar peak, a steep neck as solar drops faster than demand declines, and a head at the evening peak.
The shape was first drawn out by California ISO planners in 2013 to illustrate the operational consequence of the state’s rooftop and utility-scale solar buildout. Each subsequent year of solar additions deepened the belly and steepened the neck. CAISO’s spring weekdays now print midday net loads under 10 GW against evening peaks above 30 GW, an evening ramp the gas-and-hydro fleet must cover in roughly three hours. ERCOT, with West Texas wind and a growing utility-scale solar fleet, prints a similar shape on shoulder-season days. PJM, with less penetrative solar but a heavier rooftop component in New Jersey and Maryland, prints a milder version on the same physics. Every grid with material variable-renewable share runs some flavor of the curve.
The duck shape is what makes gas-fired generation indispensable to the grids that have decarbonized fastest. The midday belly is the part of the day a battery-and-renewables-only system can plausibly cover, with overbuild and storage. The evening ramp is harder. A 20 GW load increase over 180 minutes requires 20 GW of fast-starting flexible capacity standing ready every afternoon, and the only resource that delivers that profile at the scale and duration the grid requires is gas-fired generation, primarily F-class and H-class combined cycles cycling against the residual load and simple-cycle peakers covering the steepest 30 to 60 minutes of the climb. The duck is the operational reason gas demand for power has not declined as renewables have grown; it has been redistributed through the day into shorter, sharper windows where the marginal MW is more expensive to deliver.
The AI Data Center Demand Surge
Through 2008 to 2023, US electricity demand growth ran at 0.5 to 1.0 percent per year, with energy-efficiency gains across LED lighting, ENERGY STAR appliances, and industrial process improvements roughly offsetting population and economic growth. The flat-load era was a baseline assumption in every utility integrated resource plan and every ISO long-term planning document filed in the post-2010 period.
The training and inference compute workload of large language models, image and video generation, and the broader generative AI deployment changed the trajectory sharply through 2023 and 2024. EIA’s Annual Energy Outlook 2024 raised its 2030 power demand forecast by approximately 200 TWh (roughly 5 percent of total US electricity demand) from the prior year’s outlook, attributing most of the revision to data center load growth alone. ERCOT raised its 2030 peak demand forecast from approximately 85 GW in its 2023 Capacity, Demand, and Reserves report to over 130 GW in its 2024 and 2025 reports, driven primarily by data center interconnection requests in the Houston, San Antonio, Dallas-Fort Worth, and Permian regions. PJM’s 2024 long-term load forecast added roughly 50 GW to its 2034 peak relative to the prior year’s forecast.
The hyperscaler announcements through 2024 and 2025 made the demand inflection visible. The OpenAI / Oracle / SoftBank / MGX Stargate joint venture, announced Tue Jan 21, 2025 at the White House, committed $500 billion in US data center investment over four years with the first $100 billion deployed in 2025, and located its first cluster in Abilene, Texas under a development arrangement with Crusoe Energy. Microsoft contracted with Constellation Energy in September 2024 for the restart of Three Mile Island Unit 1 as a 837 MW dedicated nuclear power supply for its data center fleet, targeted in-service for 2028 with a 20-year power purchase agreement. Amazon contracted with Talen Energy for a behind-the-meter power supply at the Susquehanna nuclear facility in Pennsylvania, structured as a direct-connected campus rather than a grid-following arrangement, with FERC and PJM proceedings testing the regulatory limits of the structure. Meta and Google each signed multi-gigawatt power purchase agreements with merchant generators across PJM, ERCOT, and SERC.
The gas-fired generation response began to show in interconnection queues and announced project lists. Across PJM, ERCOT, MISO, and SERC, roughly 40 to 60 GW of new CCGT and peaker capacity entered the interconnection queues between 2024 and early 2026, with a meaningful share of the volume specifically tied to data center load contracts at named sites. The Texas Energy Fund, established by Texas Senate Bill 6 and Texas Senate Joint Resolution 64 in 2023 and approved by Texas voters as Proposition 7 in November 2023, made $5 billion of state-backed low-interest loans available for new dispatchable generation in ERCOT, with applications and conditional commitments running through 2024 and 2025 for roughly 9 to 10 GW of new gas capacity. PJM’s Reliability Resource Initiative, opened in early 2025, accelerated the interconnection process for a defined slate of new dispatchable generation projects.
The supply-side response showed in turbine orderbooks. GE Vernova, Siemens Energy, and Mitsubishi Power each reported H-class gas turbine delivery lead times of 18 to 36 months as of late 2024 and into 2025, with a meaningful share of forward orderbook coverage already committed to data center, hyperscaler-anchored, or merchant-developer customers. The bottleneck moved from project economics to manufacturing capacity. A merchant developer placing an H-class order in the second half of 2025 would not see commissioning before 2028 or 2029.
The implication for gas demand is direct. Power-sector gas burn could rise from roughly 30 Bcf/d in 2024 to 35 to 40 Bcf/d by 2030 if the announced data center buildout proceeds at the announced pace, with the largest incremental burn centered in Texas and the Mid-Atlantic. The incremental burn is the demand-side counterpart to the supply-side buildout that occupied chapters 6 through 9. The grid that the prior chapters’ molecules ultimately serve has just changed shape.
The Capacity Question
The US power sector has historically been built with a roughly 15 percent reserve margin, the ratio of installed capacity to forecast peak demand expressed as the percentage by which capacity exceeds peak. The reserve margin gives the system operator the cushion to cover forced outages, derates, and forecast errors at the peak. Through 2010 to 2020 the margin was eroded by coal retirements, partly offset by demand-side energy efficiency gains and renewable additions, and held above the regional reliability target in most footprints by a comfortable enough cushion that the question rarely surfaced as an immediate operational concern.
Through 2023 to 2026, the data center demand surge has tightened the margin in several footprints. ERCOT’s 2024 Capacity, Demand, and Reserves report identified a 2027 reserve margin shortfall against the operating reserve target on the basis of the updated peak forecast. PJM’s 2024/25 capacity auction cleared at $269.92 per MW-day, an order-of-magnitude increase over the prior auction cycle, on the basis of demand growth and projected coal retirements colliding with slow new-build. MISO’s resource adequacy proceedings have flagged Local Resource Zones 2, 3, 4, and 7 (the central and southern-Michigan, Indiana, and Iowa zones) as the most reserve-margin-constrained subregions through the 2027 to 2030 horizon. SERC’s North American Electric Reliability Corporation Long-Term Reliability Assessment, the LTRA, has flagged elevated risk for the central and Midwest subregions through the 2027 to 2029 outlook.
The capacity question is whether sufficient firm, dispatchable generation can be sited, permitted, contracted, and brought online in time to maintain reliability through the demand growth. The gas-fired generation industry’s answer is that the resource exists, the manufacturing capacity exists subject to the orderbook lead times, and the constraint is permitting and transmission interconnection rather than fundamental technological capability. Texas, Pennsylvania, Ohio, Louisiana, and the Carolinas have all moved to streamline siting and air-permitting processes for new gas plants tied to data center load. FERC’s Order 2023 (the July 2023 generator interconnection reform) and its 2024 Order 2023-A clarification have begun to clear the long backlogs in the ISO interconnection queues, although the practical effect on commissioning dates is still working through the system.
The risk is that the demand forecast overshoots. Hyperscaler capital expenditure commitments are revised quarterly. AI compute efficiency gains at the chip level, at the model architecture level, and at the data center cooling level can reduce the realized power consumption per unit of useful inference. Some announced data centers will not be built, some will be built smaller, and some will draw less power than the nameplate suggests. The 2001-era CCGT industry in the United States overbuilt against a forecast of merchant power demand that did not materialize on schedule, and a generation of merchant developers spent the early 2000s working through the resulting capacity overhang. The cycle that began in 2024 is not the same cycle, but the shape of the risk is recognizable.
Calpine, the Largest CCGT Operator
Calpine Corporation was incorporated in 1984 and built and acquired a series of gas-fired and geothermal plants through the late 1980s and the 1990s. The company expanded aggressively through the late 1990s and early 2000s into the merchant power buildout that defined the era, financed primarily through high-yield debt against long-term gas-fired generation projects. The 2001 California electricity crisis and the 2001-to-2002 collapse of merchant power prices left Calpine with a stranded fleet and a balance sheet it could not service. The company filed for Chapter 11 protection on Tue Dec 20, 2005 and emerged from bankruptcy on Thu Jan 31, 2008 with the gas-fired fleet intact and the debt restructured.
Through the 2008-to-2018 period Calpine operated as a public independent power producer focused on natural gas and geothermal generation, with roughly 26 GW of installed gas-fired capacity at its peak, the largest pure-play CCGT fleet in the United States. In 2018 Energy Capital Partners led a take-private acquisition at $5.6 billion in equity value and roughly $17 billion in enterprise value. In January 2025 Constellation Energy announced acquisition of Calpine in a transaction valued at approximately $26.6 billion in cash, stock, and assumed debt.
The corporate sequence tracks the rise of gas-fired generation through one company’s balance sheet: a 1980s start-up, a 1990s merchant-era expansion, a 2005 chapter 11, a 2008 emergence, a decade of operating as the largest US merchant CCGT fleet, a 2018 take-private, a 2025 strategic acquisition by the largest US nuclear operator. The 2025 deal closed on the basis that gas-fired and nuclear generation, run together by a single operator, are the strongest dispatchable platform for the AI data center demand decade. Whether it is the right bet will be visible in the spark spreads, the capacity prices, and the hyperscaler buying behavior of the late 2020s.
Gas-fired generation is the demand-side cornerstone of US gas consumption and is now the binding constraint in the AI data center buildout. Chapter 13 covers the second large demand-side block, industrial and residential consumption.