Seasonality and Weather
Heating and cooling degree days, hurricanes, freeze-offs, crop drying, storage injection and withdrawal cycles, pipeline maintenance windows, the LNG cargo calendar, and how the same molecule prices differently in January and July.

On Sun Jul 7, 2024, the National Hurricane Center upgraded Tropical Storm Beryl to a Category 1 hurricane in the western Gulf of Mexico, with sustained winds of 80 miles per hour and a forecast track aimed at the central Texas coast. Beryl had already crossed the Yucatan Peninsula as a Category 2, weakened over land, then re-intensified over the warm Gulf shelf in less than 24 hours. The storm made landfall near Matagorda, Texas, on Mon Jul 8, 2024, between 4 and 5 AM Central Time as a Category 1 with sustained winds of approximately 80 miles per hour, then moved north-northeast across the Houston metropolitan area through the morning.
The Texas Gulf Coast LNG export complex began precautionary shut-ins on Sun Jul 7. Freeport LNG on Quintana Island, Cheniere’s Sabine Pass terminal at the Texas-Louisiana border, and Cheniere’s Corpus Christi terminal each ramped feedgas intake down through Sunday and into Monday. Combined feedgas demand at the three terminals fell by roughly 4 Bcf/d from the pre-storm baseline at peak shut-in. Front-month NYMEX Henry Hub settled lower on the Monday close as the surplus gas displaced by the LNG outage backed up onto the Gulf Coast pipeline grid. TTF on the Continent and JKM in northeast Asia traded higher on the same news, on the loss of US cargo loading volume into the global supply pool.
The storm passed inland through Monday afternoon. Sabine Pass and Corpus Christi resumed feedgas intake within 48 hours; Freeport’s restart ran longer on storm-related electrical service issues at the Quintana Island plant. Henry Hub recovered within a week. The episode was a clean illustration of a structural shift the chapter will trace: the Gulf Coast hurricane that once shut in supply now shuts in demand.
The Annual Cycle in One Paragraph Stack
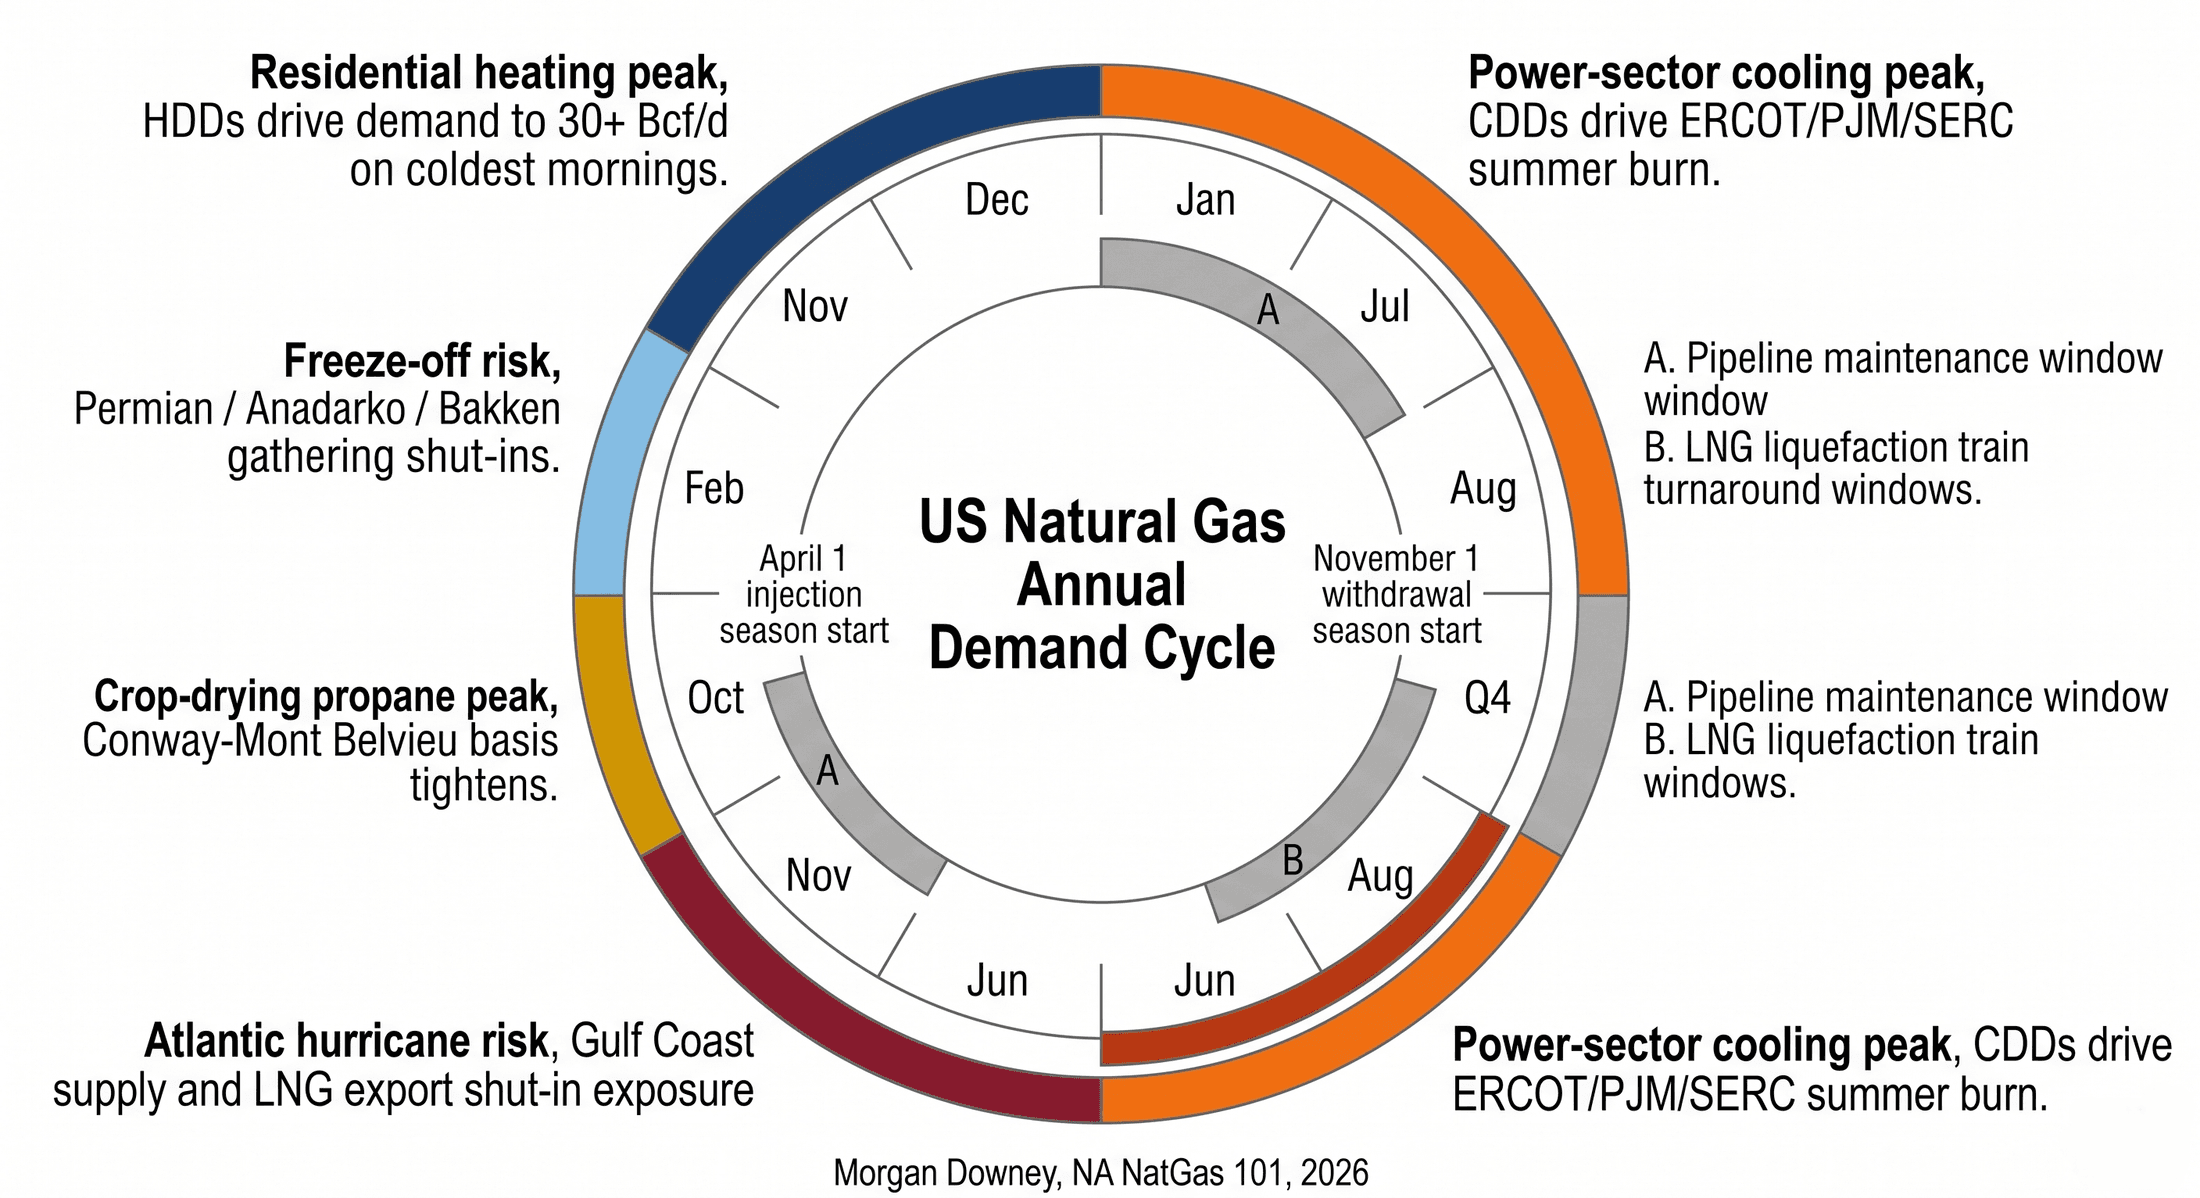
The US natural gas year runs as an integrated cycle of injection, withdrawal, and weather-driven demand peaks. April 1 is the conventional start of the EIA injection season at the storage week-ending boundary; November 1 is the conventional start of withdrawal season. Within the two windows the demand stack runs five overlapping seasonal patterns. Residential heating demand builds through November and peaks December through February. Power-sector cooling demand peaks late June through August. Crop-drying propane demand peaks mid-October. Atlantic hurricane risk runs June 1 through November 30, with peak intensity in August and September. Freeze-off risk on the Permian, Anadarko, Bakken, and Mid-Continent gathering systems runs December through February.
The five windows do not align. A cold January night drives residential heating to its peak. A hot July afternoon drives gas-fired power generation to its peak. An October freeze on a wet corn harvest drives Mid-Continent propane retail distribution to its peak. A Category 3 hurricane in late August can shut in 5 to 10 Bcf/d of Gulf Coast production, processing, and LNG export feedgas demand for several days. A freeze-off on a single February cold morning in the Permian can shut in 2 to 5 Bcf/d of Texas dry gas production through the gathering grid.
The cycle does not repeat identically year to year. Each year carries its own polar vortex pattern, hurricane track, summer heat structure, ENSO state, and crop-harvest moisture profile, and the forward curve absorbs the expected pattern through the V/X spread and the calendar-strip relationships covered in Chapter 15. The forward curve is the market’s prior on the next twelve months of weather. The Thursday EIA Weekly Storage Report is the running update against that prior. Gas does not trade as a single commodity across the year. It trades as January gas, February gas, April gas, August gas, October gas, each priced separately on the calendar curve and each clearing against a different demand profile and a different supply-side risk.
Heating Degree Days and the Residential Winter Peak
Heating Degree Days are the standard measurement of weather-driven heating demand. Chapter 13 covered the 65-degree base and the daily calculation. The forecast structure that the trade reads daily is built on top of that base. NOAA’s National Centers for Environmental Information publishes daily HDDs for each US weather station, then aggregates them to state, census region, and national totals on a population-weighted basis. The population weighting matters because the cold cities where most gas-heated households live (Chicago, Minneapolis, Detroit, New York, Boston, Philadelphia, Pittsburgh, Cleveland, and the smaller Northeast and Midwest urban centers) drive the national aggregate more than the population-light cold states in the Northern Plains.
Trader screens carry the next 1-day, next 7-day, next 14-day, and seasonal HDD forecasts updated multiple times per day from NOAA, the European Centre for Medium-Range Weather Forecasts, and the operational US Global Forecast System. The 6-to-10-day and 11-to-15-day NOAA Climate Prediction Center outlooks are the two reference forecasts that the gas trade reads on a routine basis. The CPC seasonal outlook (the 3-month outlook) is published on the third Thursday of each month and provides probability-anomaly maps for temperature and precipitation across the Lower 48. The 90-day outlook is anchored on the El Niño / La Niña / Neutral state of the equatorial Pacific Ocean, which has documented historical correlation with US winter temperature patterns. La Niña winters tend to bring colder-than-normal temperatures to the northern tier of the US (the high-HDD Northeast and Midwest) and warmer-than-normal temperatures to the southern tier; El Niño winters tend toward the opposite pattern. The trade reads the seasonal ENSO outlook in late summer and early fall and prices the November-through-February strip accordingly.
Two numerical weather prediction models dominate the world. The ECMWF’s Integrated Forecasting System, run out of Reading, England, is universally called the “European Model” on trading desks. NOAA’s GFS, run out of College Park, Maryland, is the “US Model” or “American Model.” Almost every weather forecast on a phone, a TV broadcast, or an aviation flight plan anywhere in the world is downstream of one of those two model runs, blended with a regional or proprietary post-processing layer. The North American gas and power trade reads them both, side by side, multiple times a day.
Each model runs at fixed cycles. The European Model runs at 00 and 12 UTC (8 PM and 8 AM EDT, one hour earlier on standard time), with operational output dissemination beginning roughly six hours after each cycle start (so the 00 UTC run becomes visible to subscribers in the small hours of the New York morning, and the 12 UTC run becomes visible mid-afternoon). The GFS runs at 00, 06, 12, and 18 UTC (8 PM, 2 AM, 8 AM, and 2 PM EDT), with output available roughly four hours after each cycle start. The output dataset for a single global run is hundreds of gigabytes, dozens of variables on a fine-resolution grid, hundreds of forecast hours forward. At each model-run release time the desk meteorologists at gas marketers, hedge funds, utilities, and trading houses race to ingest the new run, compare it against the prior cycle, and price the change in expected HDDs or CDDs across the regions that drive the Henry Hub strip and the cash-basis hubs. The gas market routinely moves at each release, the early-morning availability of the 00 UTC European Model run and the late-afternoon availability of the 12 UTC run setting the day’s positioning, with the GFS cycles adding fresh information at the intermediate hours. The size of the move depends on how far the new run has shifted relative to the consensus the market had already priced.
Since approximately 2023, machine-learning weather models have entered the operational forecasting set. Google DeepMind’s GraphCast, Microsoft’s Aurora, NVIDIA’s FourCastNet, and Huawei’s Pangu-Weather each train a neural network on the same ECMWF reanalysis dataset that grounds the physics-based models, then run inference orders of magnitude faster and at substantially lower compute cost than a traditional partial-differential-equation solver. ECMWF itself has integrated AIFS, its own machine-learning model, into its operational suite alongside IFS. The post-2023 result has been that the AI models have matched or modestly outperformed the operational physics models on standard medium-range skill metrics for many variable-and-region combinations. Trading desks have begun to read the AI runs alongside the European Model and the GFS as a cross-check; the consensus blend across physics and machine-learning runs is what the gas market is now pricing into the front of the curve. The structural implication for the trade is that forecast quality at the 7-to-15-day horizon, where the gas market does most of its short-term repositioning, has improved year over year and is likely to continue to.
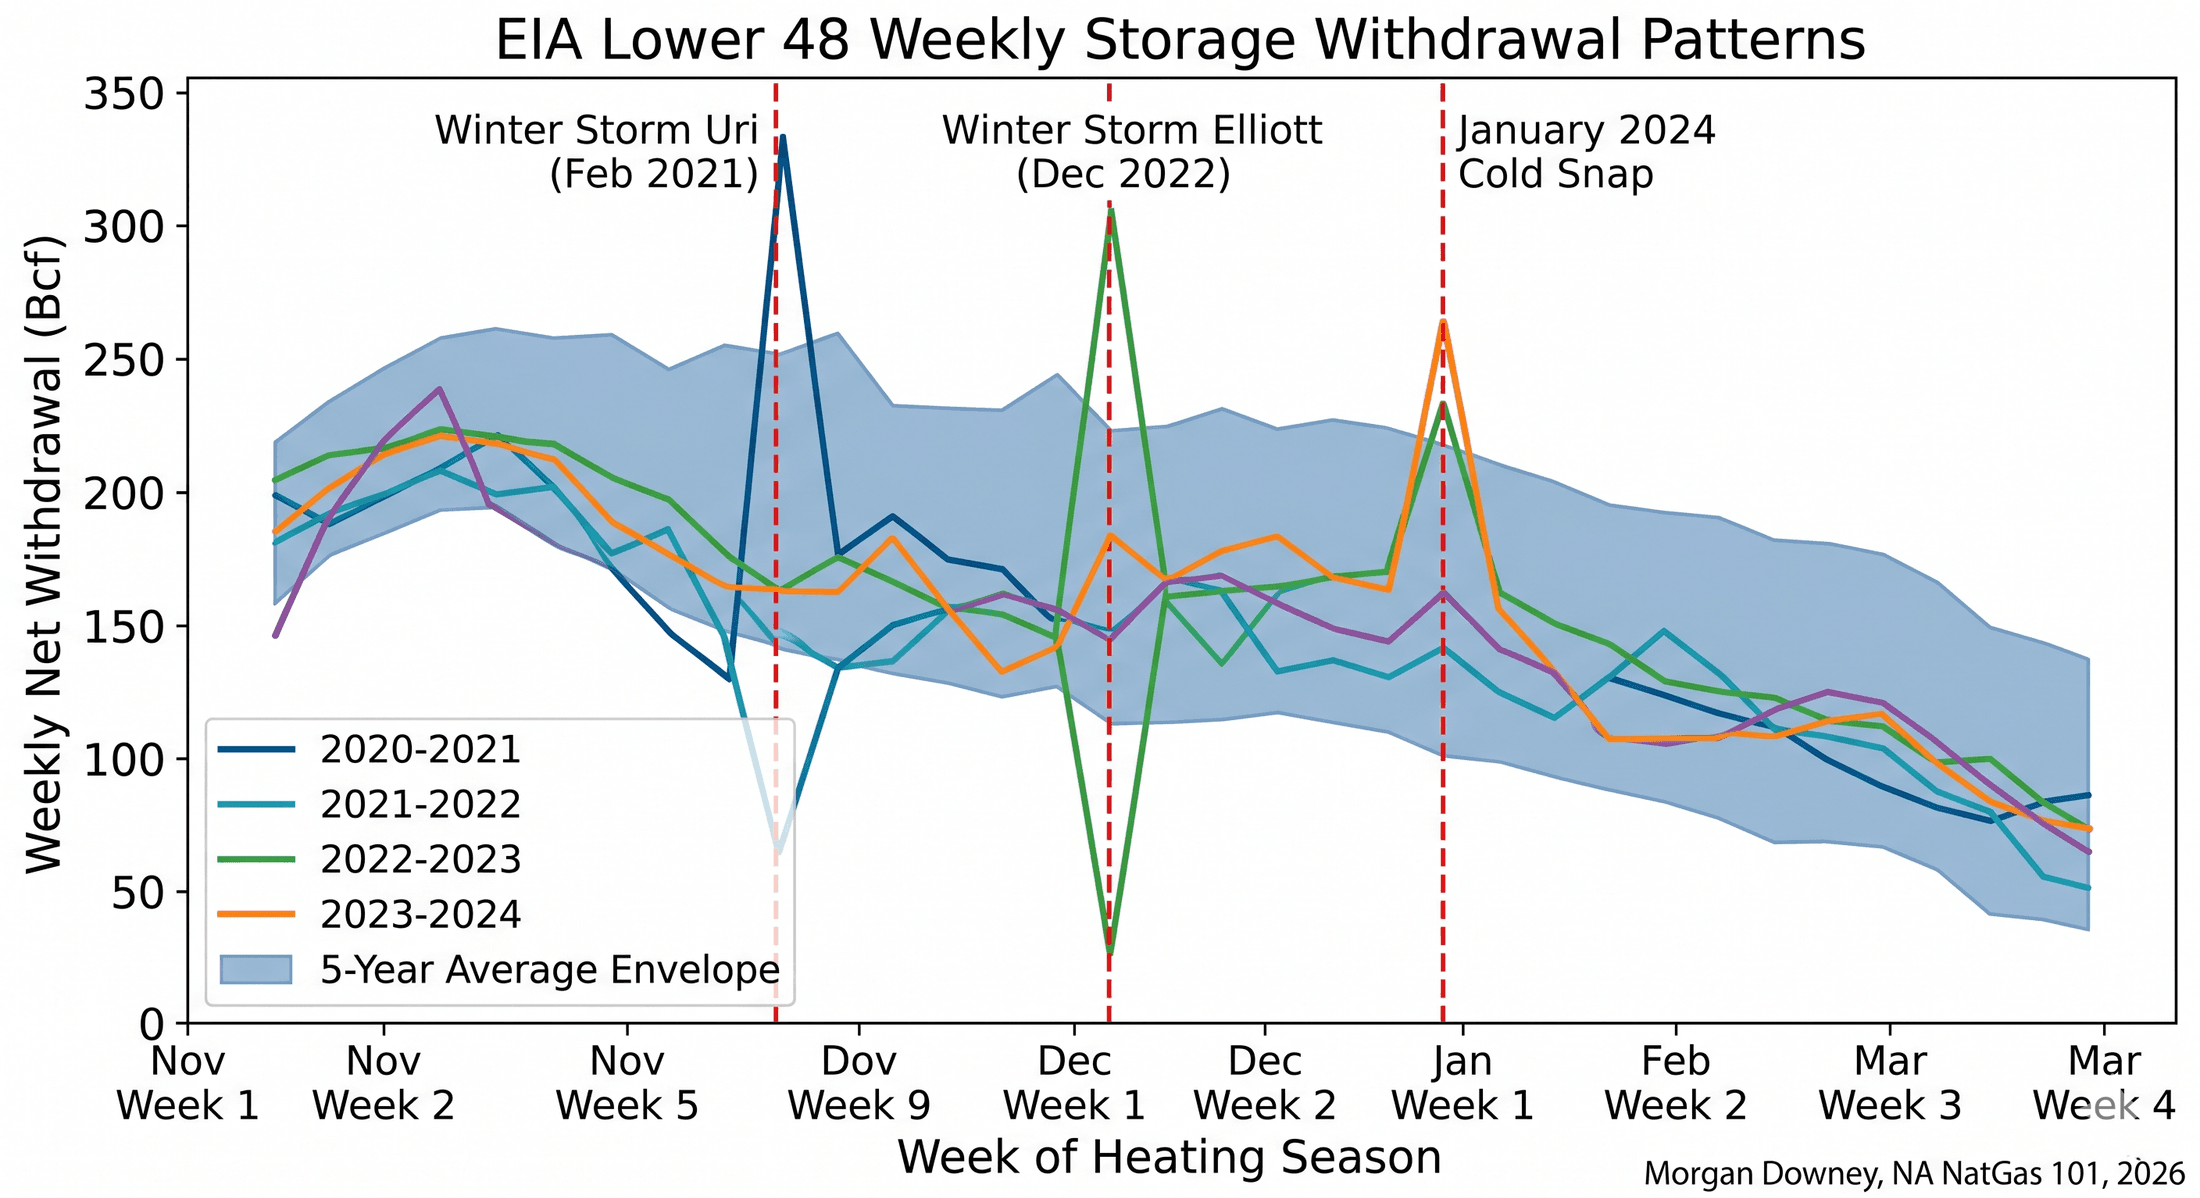
The four canonical residential-heating events of the modern era illustrate the limits of the forecast. The early-January 2014 polar vortex sent the front-month NG into a multi-week peak that the storage system absorbed (covered in Chapter 11). The early-January 2018 bomb cyclone, an explosively deepening extratropical cyclone off the East Coast, drove single-day Northeast city-gate basis to historic levels at Algonquin Citygate and Transco Zone 6. Winter Storm Uri in February 2021 was the dominant event of the decade, with national HDDs running far above normal across Texas, Oklahoma, and the southern Plains during the peak event. Winter Storm Elliott in late December 2022 produced the next major event, with the Christmas-week cold snap pulling the largest weekly storage withdrawal on record at the time. Each event was the visible expression of a specific weather pattern that the forecast models had partially anticipated and partially missed. The seasonal pricing on the November-February strip prior to each year incorporated the trade’s prior on a normal cold winter. The actual outcome cleared against the forward curve through the realized HDD path.
Cooling Degree Days and the Summer Power-Sector Peak
The Cooling Degree Day is the summer counterpart to the HDD. CDDs for a given day are the daily average temperature minus 65 degrees Fahrenheit when the average exceeds the base; below 65 the CDD is zero. The CDD aggregate drives gas-fired power generation through the residential and commercial air-conditioning load that the electric grid must meet. The summer power-sector gas peak runs from late June through August, with regional differences in magnitude, shape, and what limits supply.
ERCOT drives the largest summer power-sector gas burn in the US. Texas summer peak gas-fired generation pulls roughly 18 to 20 Bcf/d on a peak afternoon in extreme heat, against a winter Texas power-sector burn of roughly 6 to 8 Bcf/d outside freeze events. PJM and the SERC footprint together add another 10 to 15 Bcf/d of summer peak demand on their own peak afternoons, drawn against the Marcellus and Eastern Gulf Coast supply basins. CAISO’s summer peak is smaller in absolute terms but constrained by the limited California gas pipeline import capacity and by SoCalGas storage limitations since the post-Aliso Canyon working-gas inventory cap covered in Chapter 11.
Heat dome events, stationary high-pressure ridges that hold over a region for a week or more, produce the most intense summer peaks. The 2021 Pacific Northwest heat dome from Sun Jun 27 through Tue Jun 29, 2021, set all-time temperature records at Portland, Oregon, Seattle, Washington, and Lytton, British Columbia, with the Lytton station reaching 49.6 degrees Celsius (121 degrees Fahrenheit) before a wildfire destroyed the village. The 2023 Texas summer set multiple all-time peak load records on the ERCOT system, with peak demand exceeding 85 GW on multiple days through July and August and the heat dome holding over the state through the bulk of the summer. The summer 2022 European heat dome and the summer 2024 Mid-Atlantic heat events each pulled record gas demand through the affected regional grids on similar mechanics.
The summer demand pattern interacts directly with the storage cycle. Peak summer power burn slows the injection rate that fills the storage system through the April-October window. A hot summer leaves the system entering November with lower than expected inventory, and the front-month NG and the November-February strip price up accordingly. A cool summer leaves storage at or above the five-year average and the strip prices down. The November-October V/X spread that Chapter 15 covered is the forward-curve expression of the trade’s prior on the inventory entering withdrawal season.
The Storage Cycle as the Integrator
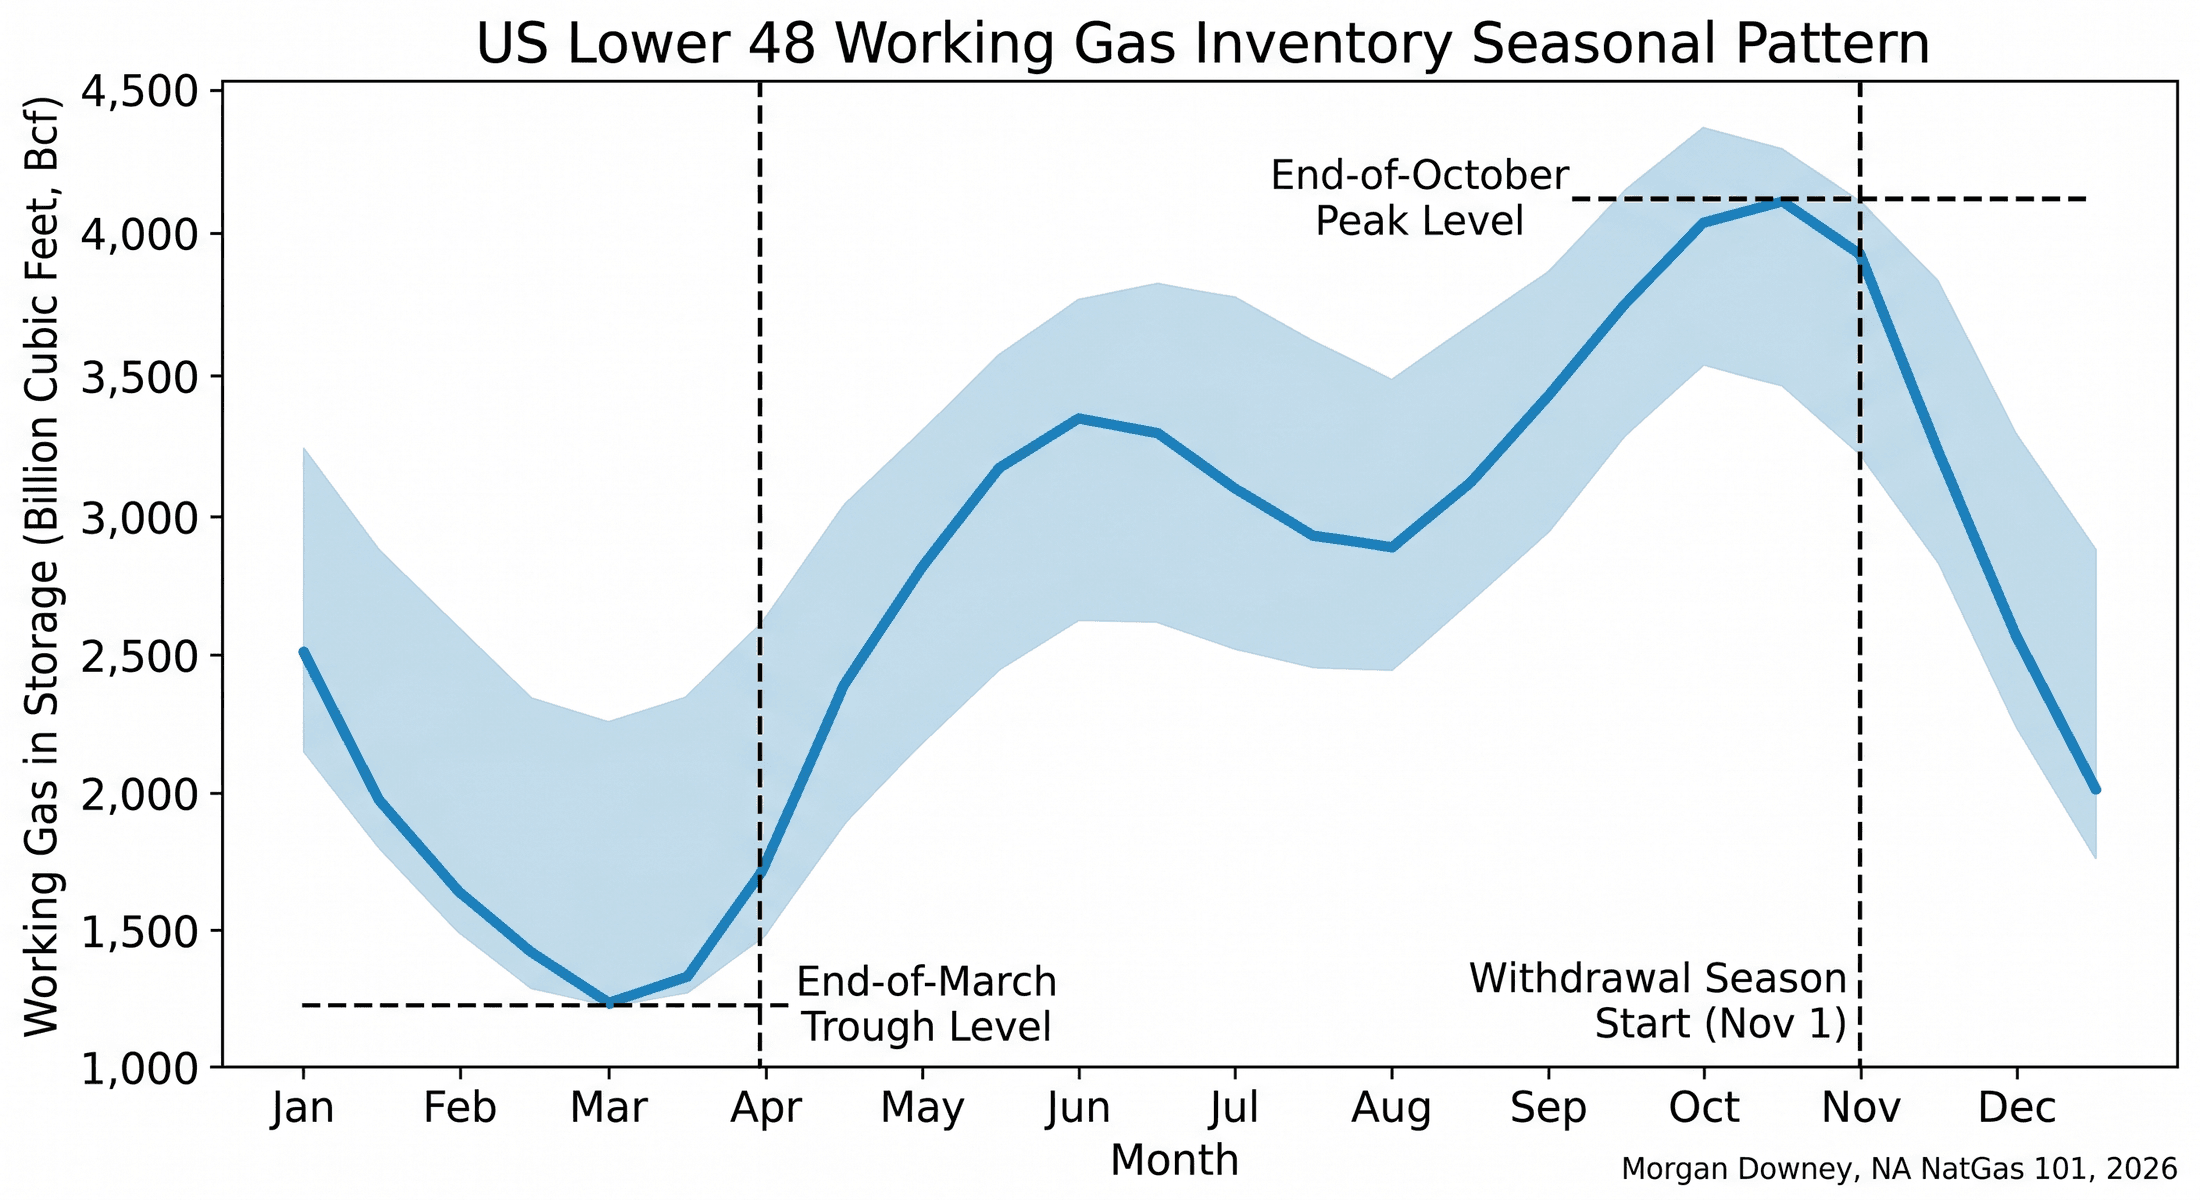
Chapter 11 covered the operational mechanics of the four storage types. This section addresses how the seasonal cycle integrates the year. Working gas inventory at end of October across the Lower 48 has typically peaked in the range of 3.6 to 3.9 trillion cubic feet over the post-2010 period, against a typical end-of-March trough in the range of 1.4 to 1.8 trillion cubic feet. The seasonal injection therefore runs roughly 2.0 to 2.4 trillion cubic feet over the April-October window; the seasonal withdrawal runs the same magnitude over the November-March window.
The injection-withdrawal cycle anchors three commercial structures the prior chapters covered. It anchors the November-October V/X calendar spread on the NYMEX NG curve (Chapter 15). It anchors the storage tariff structure of demand charges plus injection and withdrawal volumetric charges (Chapter 11). It anchors the bidweek pricing pattern at every physical hub, where the November bidweek prints higher than the October bidweek by approximately the V/X spread net of basis (Chapter 15).
The cycle is also the operational mechanism that buffers the weather-driven demand surprises. A cold January week that pulls 300 Bcf out of storage against an analyst-consensus expected 200 Bcf prints a “bullish” storage report on the following Thursday morning and moves the front-month NG inside 60 seconds of the 10:30 AM Eastern release. A warm February week that draws only 80 Bcf against an expected 150 Bcf prints “bearish” and moves the contract the other direction. The Thursday release is the visible weekly read on the integrated weather-and-demand balance, and the size of the surprise relative to consensus is a direct read on the realized weather path against the forecast that the consensus had already priced.
Sustained imbalances in either direction propagate through the calendar curve. A tight winter, with realized withdrawals running consistently above the five-year average, prices the following injection season down (the system needs to refill from a deeper trough) and prices the following withdrawal season up (the system enters with a thinner cushion). A loose winter does the opposite. The post-2018 storage market has repeatedly demonstrated this dynamic. The mild winter of 2023-2024 left the Lower 48 storage system at one of its highest end-of-March troughs on record, above 2.3 Tcf, and the resulting summer 2024 NG curve traded below $2 per MMBtu through much of the second quarter as injections filled an already-near-full system. The forward curve responded as the storage cycle imposed the supply-and-demand balance directly onto the weekly print.
Hurricanes and Gulf Coast Supply-and-Export Risk
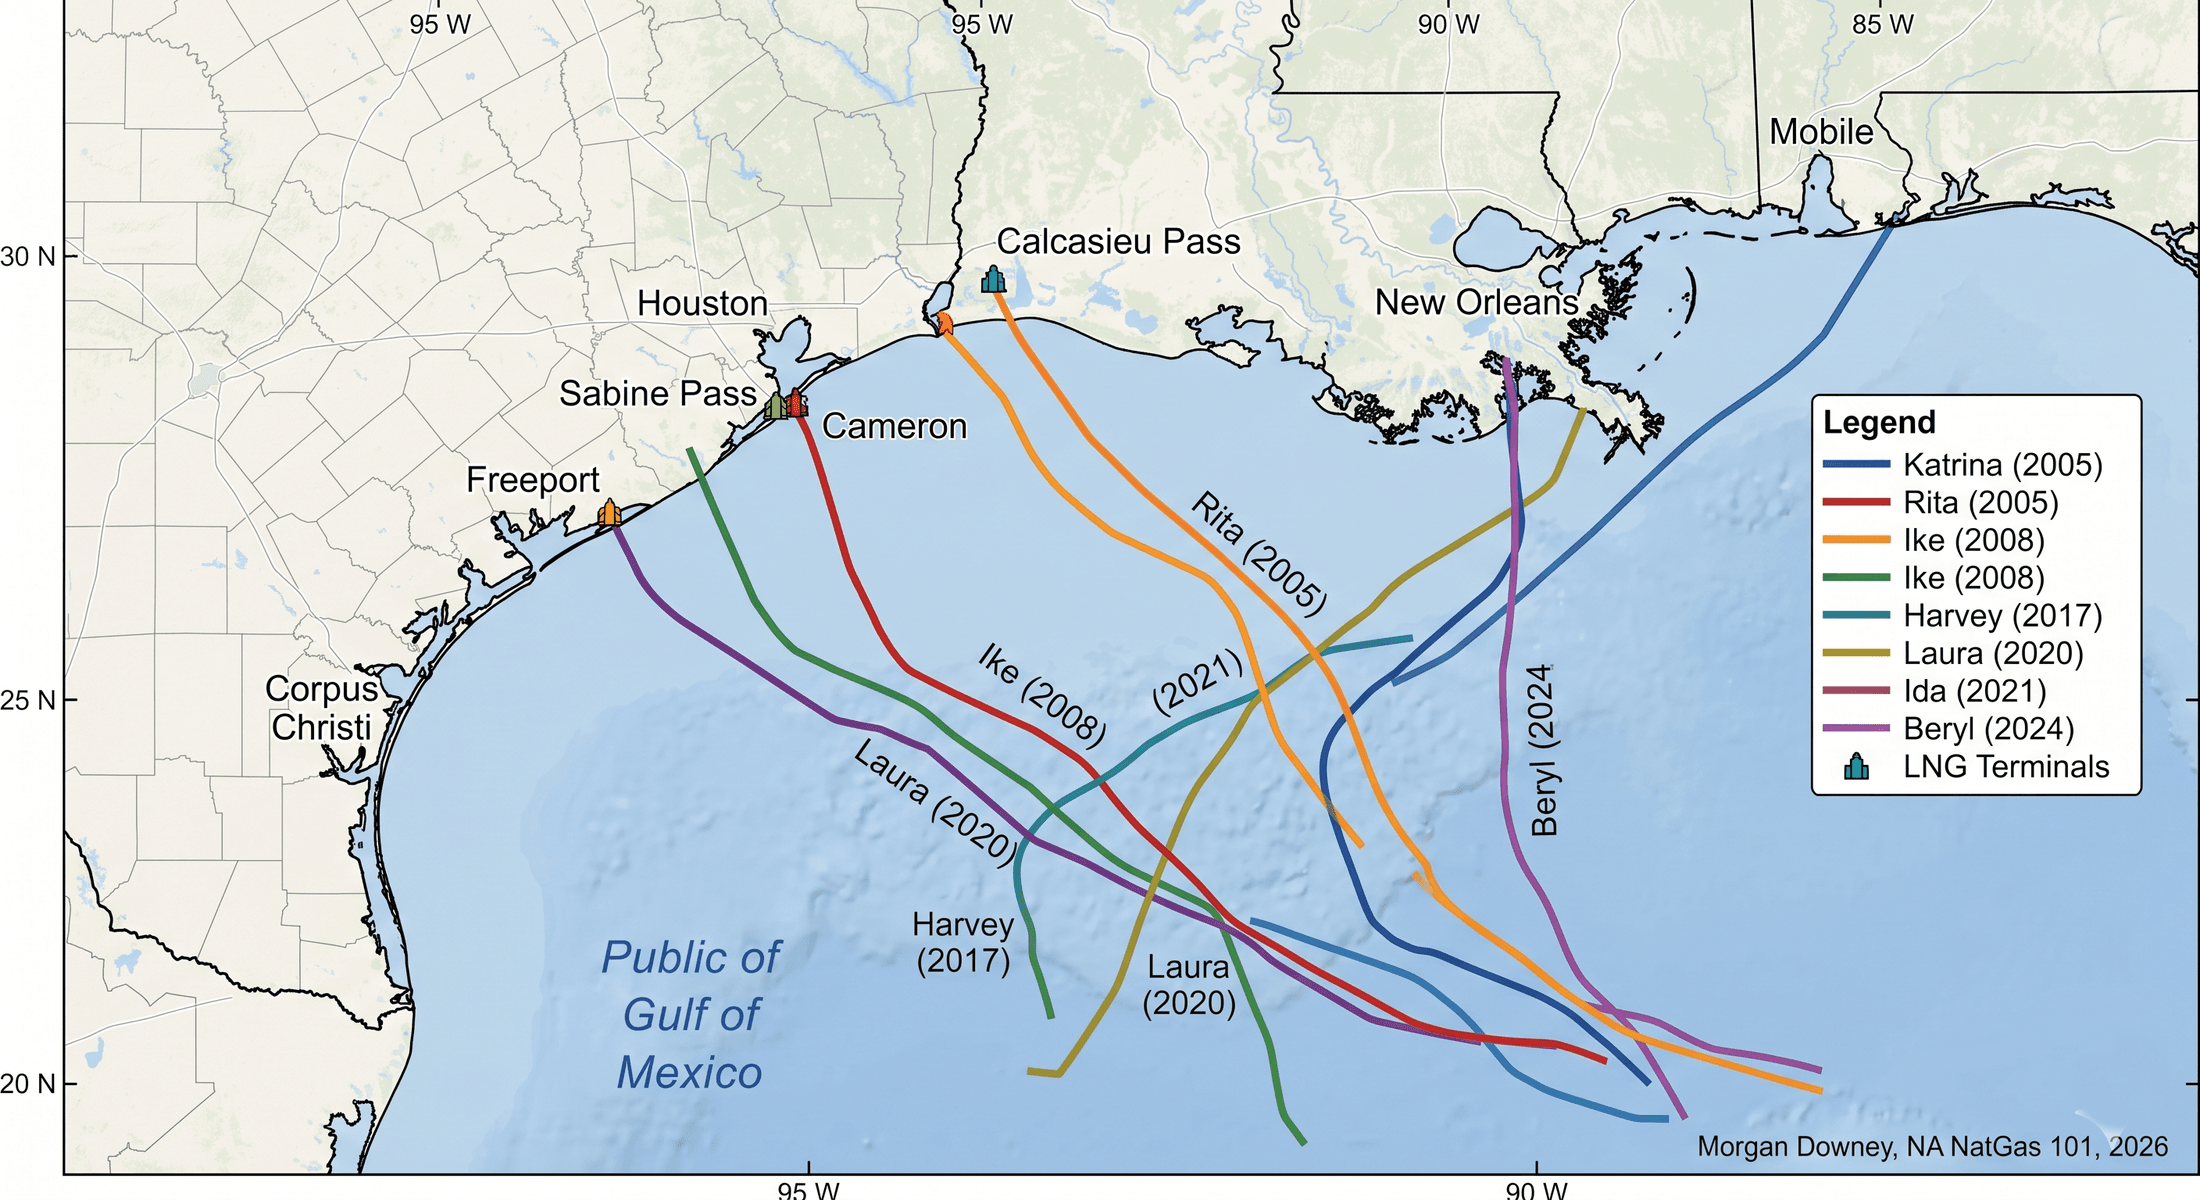
The Atlantic hurricane season runs from Wed Jun 1 through Sun Nov 30 by NOAA convention, with peak intensity in August and September. The Gulf of Mexico is the most exposed US gas-system region. Federal-waters Gulf of Mexico gas production runs roughly 1.5 to 2.0 Bcf/d in the post-2020 period, down from over 12 Bcf/d at the early-2000s peak as production has migrated to onshore basins. The Sabine Pass, Corpus Christi, Cameron, Freeport, Plaquemines, Calcasieu Pass, and Golden Pass LNG terminals all sit on the Texas or Louisiana Gulf Coast, and the Houston Ship Channel petrochemical complex anchors the LNG feedgas pipeline grid.
A major hurricane making landfall in the Texas-Louisiana corridor can shut in 5 to 15 Bcf/d of Gulf Coast gas production, gas processing throughput, and LNG export feedgas demand for days. The historical record runs through Hurricanes Katrina and Rita in August-September 2005, Hurricane Ike in September 2008, Hurricane Harvey in late August 2017, Hurricane Laura in late August 2020, Hurricane Ida in late August 2021, Hurricane Beryl in early July 2024, and numerous smaller events. The structural shift since 2005 is in the exposure mix. The 2005 Katrina-Rita sequence took out a substantial share of US Gulf federal-waters gas production at peak shut-in (with cumulative production losses of several hundred Bcf in the months that followed), in an era when Gulf federal-waters production was a major share of total US supply.
By 2024, Gulf federal-waters gas production was a small share of total US production after the structural migration to Marcellus, Permian, and other onshore basins covered in Chapter 10. But Gulf Coast LNG export feedgas demand had grown to roughly 14 Bcf/d in 2024, with another 5 to 7 Bcf/d coming online over 2025-2027 from the Plaquemines ramp, Corpus Christi Stage 3, Rio Grande LNG, and Port Arthur LNG (Chapter 14). The exposure flipped sides. Hurricanes once shut in supply, removing molecules from the pipeline grid and pulling Henry Hub higher. Modern hurricanes shut in demand, removing LNG feedgas takeaway and pushing surplus gas back onto the domestic grid.
The Henry Hub price response now typically runs the opposite direction from the 2005 pattern. Henry Hub typically falls on a major Gulf Coast hurricane landfall (less LNG feedgas demand at the wellhead, surplus gas displaced onto the domestic system); TTF on the European side and JKM in northeast Asia typically rise (less US LNG cargo loading volume into the global supply pool). The price arbitrage that the global LNG market runs against US Gulf Coast feedgas (covered in Chapter 14) inverts during the multi-day shut-in window and reverts to its prior shape as the terminals restart. Hurricane Beryl in July 2024 was the clearest recent illustration of the modern pattern, with the front-month NG closing lower while the JKM strip closed higher on the cargo loss. The structural reversal will deepen as the LNG export buildout continues through 2027.
Freeze-Offs and the Cold-Weather Supply Risk
Freeze-offs are the cold-weather supply-side counterpart to hurricanes. A freeze-off occurs when low temperatures freeze water vapor and condensate in the wellhead Christmas tree, in the gathering pipeline network, or at the gas plant inlet, and shut in production until the equipment can be thawed. The Permian Basin, the Anadarko, the Bakken, and the broader Mid-Continent are the most exposed regions because the wellhead and gathering infrastructure was designed for typical Texas and Oklahoma winter temperatures rather than for the temperatures that polar-vortex events produce.
Texas dry gas production fell roughly 30 percent at peak during Winter Storm Uri (Feb 14-19, 2021), removing approximately 5 to 7 Bcf/d of supply from the system over the storm period. The Permian and Anadarko production losses during the February 2021 event drove the simultaneous power-grid collapse covered in Chapter 12: gas-fired generators that depended on Permian feedgas were curtailed because the upstream production and gathering had frozen. The freeze-off and the power outage were the same event running in two directions through the same infrastructure.
The Texas Railroad Commission and the Public Utility Commission of Texas issued post-Uri weatherization rules requiring upstream producers and gathering operators to harden equipment against cold weather. Senate Bill 3 from the 87th Texas Legislature in 2021 set the statutory framework. Compliance has been progressive across the 2022, 2023, 2024, and 2025 winters, with each subsequent freeze-off event showing somewhat smaller shut-in percentages than Uri at comparable temperature levels.
The January 2024 cold snap, an arctic blast that pushed temperatures across Texas, Oklahoma, and the southern Plains to single digits and below for several days in mid-January, shut in roughly 15 to 20 percent of Texas dry gas production at peak. The improvement from Uri’s 30 percent reflects the partial deployment of weatherization upgrades. Henry Hub front-month traded much higher through the event, and ERCOT operated under tight reserve margins for several days, but the catastrophic supply collapse of February 2021 did not repeat.
Freeze-offs remain a structural risk because the underlying infrastructure cannot be fully insulated against extreme cold and because producers face a cost-benefit tradeoff on weatherization investment for a tail-risk event. The freeze-off mechanic is the structural mirror image of the hurricane mechanic. A cold front from the Arctic shuts in Permian supply on a winter morning; a hurricane from the Gulf shuts in Gulf Coast LNG export demand on a summer afternoon. Both events resolve through the storage system, the basis market at the affected hubs, and the forward-curve repricing in the days that follow.
Crop Drying, Pipeline Maintenance, and LNG Cargo Timing
Crop drying is the dominant October propane demand event. The corn harvest across the Mid-Continent and corn belt typically runs from late September through early November. When corn arrives at the grain elevator at moisture content above roughly 15 percent, the elevator runs a propane-fired dryer to reduce the moisture to 13 to 14 percent for safe storage. The wetter the harvest, the greater the propane demand. Conway HD-5 propane retail draws from the Mid-Continent network can pull more than 100,000 barrels per day above the summer baseline through the October peak in a wet harvest year. The Conway-Mont Belvieu propane basis tightens through October as the inland demand pulls volume from the Mont Belvieu storage complex; the basis loosens through November as crop drying ends and the residential heating peak takes over (Chapter 19).
Pipeline maintenance windows constrain capacity in the shoulder seasons. Spring (April-May) and fall (September-October) are the two principal windows for major maintenance: compressor station overhauls, pipeline pigging and inline inspection, hydrostatic testing, and right-of-way reconstruction (Chapter 10). Pipeline operators schedule maintenance to minimize the impact on residential heating demand and on summer power-sector demand, which leaves the shoulder seasons as the available window. The maintenance schedule produces capacity reductions on specific pipeline segments at specific times, with the resulting basis impacts visible in the bidweek and daily index prints at affected hubs (Chapter 15). A typical interstate pipeline runs one or two major maintenance events per year, with the capacity reduction lasting one to four weeks per event.
LNG cargo timing follows a different seasonal pattern from the underlying domestic gas demand. European LNG buyers run their highest demand from November through March on the residential and industrial heating cycle (Chapter 13 covered the European industrial side; Chapter 14 covered the export side). Asian LNG buyers run twin peaks: November-March for heating and July-August for cooling, with the summer Asian peak driven primarily by Japanese, Korean, and southern-China power-sector cooling load. The LNG cargo flow from US Gulf Coast terminals tracks both cycles, with the destination-arbitrage relationship between TTF, JKM, and Henry Hub determining whether each cargo loaded clears Asian or European destinations. Liquefaction-train maintenance schedules at the eight US LNG terminals concentrate in the second and fourth calendar quarters, with most major turnarounds running 30 to 60 days per train per cycle. The maintenance schedule reduces feedgas demand at the affected terminal and propagates through the Gulf Coast pipeline grid as a regional supply surplus during the maintenance window.
The five seasonal demand triggers (winter heating, summer cooling, October crop drying, Atlantic hurricanes, freeze-offs) and the two operational windows (pipeline maintenance, LNG turnarounds) together write the calendar shape of the US gas year. The forward curve absorbs the expected pattern. The storage report and the basis market translate the realized pattern into weekly and daily price moves. Each season has its own peak. Each peak has its own mechanism.
The October 2018 Bidweek and the Cold-Open Storage
The October 2018 NYMEX NG bidweek closed on Wed Sept 26, 2018, with the November 2018 contract settling at $3.022 per MMBtu against an October 2018 final settlement of $3.005. Lower 48 working gas inventory entering October 2018 was running roughly 3.0 Tcf, more than 600 Bcf below the prior five-year average for the same week, after a hot summer that had pulled record power-sector burn through July and August.
The trade entered the heating season nervous. The November-October V/X spread had widened to roughly $0.50 per MMBtu through September on the inventory shortfall. NOAA’s October seasonal outlook leaned cold for the northern tier on a weak La Niña base case. A cold snap across the Northeast and Midwest in mid-November pulled an early withdrawal that the system absorbed but that priced the front-month NG to over $4.50 per MMBtu by mid-November, a rally of more than 50 percent from the October bidweek close. The episode demonstrated the calendar-curve mechanic in real time: a tight October inventory plus a colder-than-normal seasonal outlook plus an early cold event produced a front-month spike that the storage system could absorb operationally but that the forward curve had to price through. The November 2018 contract ended its life as the prompt month at the highest settlement in four years. The storage trade that had entered October short on the curve covered into the rally; the trade that had entered long captured the seasonal premium the V/X spread had been pricing all along.
Chapter 21 picks up at the cross-commodity layer, where the seasonal price moves described above transmit into the substitute markets for heating fuels and petrochemical feedstock. The seasonal calendar is the trigger; the cross-commodity arbitrage is the response.