NGL Markets and Pricing
OPIS Mont Belvieu daily assessments, ICE swaps and options, the frac spread and its components, crude-diff pricing in percent of WTI, polymer-grade ethylene, LPG arbitrage to Asia and Europe, and the hedging structures that sit on top.

In the third week of December 2013, the OPIS Mont Belvieu non-LDH HD-5 propane assessment cleared near $1.20 per gallon, the bottom of a quiet winter range that had held since the prior heating season. Mid-Continent inventories were tight against an early start to corn-drying demand the prior October, but the trade saw no immediate risk to a normal winter draw. The first arctic outbreak crossed the upper Midwest on Mon Jan 6, 2014, with temperatures reaching minus 30 degrees Fahrenheit across Minnesota and the Dakotas. Residential propane delivery trucks ran past their schedules; rural retailers ran their tanks low.
The second outbreak, a deeper and longer event, arrived in the last week of January. Conway, Kansas, the Mid-Continent fractionation and storage hub serving the propane retail network across Iowa, Wisconsin, Minnesota, and the upper Mississippi valley, lost the marginal pipeline barrel to inland demand it could not refuse. The OPIS Conway HD-5 propane daily assessment printed above $4.50 per gallon on Tue Jan 28, 2014, against a Mont Belvieu print near $2.00 per gallon the same day, with the Conway-Mont Belvieu basis above $3 per gallon for the first time in the modern history of the assessment.
State governors in Wisconsin, Minnesota, and Iowa declared propane emergencies. The Federal Motor Carrier Safety Administration suspended hours-of-service rules for propane delivery drivers across thirty-three states. The Conway-Mont Belvieu basis collapsed back toward its historical few-cents-per-gallon range over the following four weeks as the cold released and rail and pipeline takeaway caught up.
The structural lesson was permanent. Each of the five Mont Belvieu purity products has its own price, its own forward curve, its own substitutes, and its own location. The chapter that follows is the price layer that sits on top of the physical infrastructure that Chapter 18 described.
OPIS Mont Belvieu and the Price Assessment Layer
The Oil Price Information Service publishes the dominant daily price assessments for US natural gas liquids. OPIS Mont Belvieu daily assessments cover purity ethane (95 percent and 99.5 percent grades), HD-5 propane (split between non-LDH and LDH product), normal butane, isobutane, and natural gasoline, with a parallel set of assessments at Conway, Kansas. The OPIS LPG and NGL daily report has been the contractual reference for US retail propane sales agreements, for the bulk of US LPG export FOB pricing, for the ICE financial swap settlement basis, and for producer wellhead netbacks since the late 1990s.
OPIS was founded by Bill Goedde in 1977 as an independent refined-products price reporting service. IHS Markit acquired OPIS in 2017. IHS Markit and S&P Global completed their merger on Mon Feb 28, 2022, with OPIS folded into S&P Global Commodity Insights at the close. OPIS continues to operate under the OPIS brand inside the broader S&P Global commodity reporting franchise.
The OPIS daily assessment methodology surveys physical bid-and-offer activity, completed transactions, and broker price reports across a defined trading window each business day. The Mont Belvieu and Conway windows close in the early afternoon Central time. A volume-weighted assessment is published at the close, with low and high range markers and notes on supporting transaction volume. Assessment editors are required to confirm trades and follow source-protection protocols consistent with the IOSCO principles for price reporting agencies.
Argus Media publishes a parallel daily assessment series for the same products. The Argus Mont Belvieu and Conway assessments compete commercially with OPIS, with the larger Argus footprint in the global LPG market and the larger OPIS footprint in the US retail and refining markets. ICE Mont Belvieu Window assessments capture the closing trading window prints from the ICE electronic trading platform and serve as the settlement reference for the ICE listed swap contracts described in the next section. Each major US NGL contract names one of these three publishers as the contractual price source. OPIS is the most frequent choice in US-domestic supply contracts and producer netback formulas; Argus is the more frequent choice in Asian and European LPG sale and purchase agreements; ICE Window prints anchor the ICE futures and options settlement framework.
The three competing assessment series typically print within a fraction of a cent per gallon of one another on liquid trading days. Divergences appear on illiquid days, on days when one publisher captures a specific late-window trade that the others miss, and during periods of unusual market structure such as the January 2014 polar vortex episode described in the cold open. The competitive structure is the discipline. Three independent price-discovery mechanisms reading the same physical market provide a cross-check that any single assessment alone cannot provide. OPIS Mont Belvieu propane is what the contract says when the contract says propane.
ICE Listed NGL Swaps and Options
The Intercontinental Exchange lists financial swap contracts for each Mont Belvieu and Conway purity product. The contracts cash-settle monthly against the corresponding daily assessment index for the contract month. The headline products at Mont Belvieu cover purity ethane, HD-5 propane (split between LDH and Non-LDH), normal butane, isobutane, and natural gasoline. The Conway HD-5 propane contract trades alongside the Mont Belvieu propane contract as a separate listed instrument.
Each ICE NGL swap contract carries a standard size of 1,000 barrels per contract, with monthly delivery periods running through the calendar year and a listed strip extending up to 36 months forward. Substantial liquidity concentrates in the prompt 12 months, with progressively thinner open interest in years two and three. The exchange margins each contract on the SPAN methodology and clears the trades through ICE Clear US.
Listed options on the ICE Mont Belvieu HD-5 propane swap trade on a small number of strikes around the prompt month and a thin selection of back-month expirations. The options are American-style, with daily settlement against the prompt swap. Listed options on the other purity products are sparser, with most option-style structures transacted as bespoke OTC instruments rather than as listed contracts. CME Group lists a competing set of NGL swap contracts. The CME contracts have not historically achieved the liquidity of the ICE products in the Mont Belvieu purity-product complex, though CME does list a frac spread futures contract that the ICE roster does not duplicate (covered in the next section).
The over-the-counter swap market, transacted bilaterally between dealers and end-users and cleared through ICE Clear US under give-up arrangements, is several times larger than the listed swap market by volume. Most actual hedging volume on US NGLs flows through OTC swaps written against the OPIS Mont Belvieu and Conway indexes. The dealer counterparties run the same roster as the natural gas basis swap market: BP, Shell, Trafigura, Vitol, Mercuria, Macquarie, Goldman Sachs, JP Morgan, and Citigroup hold the largest positions, alongside the major midstream operators (Enterprise Products Partners, Energy Transfer, Targa Resources, ONEOK) and the larger producer treasury desks (EQT, Coterra, Range Resources, Antero Resources).
The relationship between listed and OTC volume runs the same logic as Chapter 15 covered for natural gas basis swaps. The listed market is thin but transparent. The OTC market is deep but disclosed only through quarterly filings and end-of-day clearing reports. Listed-market settlements price the OTC tickets. Dealers warehouse OTC risk and hedge it across listed swaps and futures. End-users transact OTC for the bespoke tenor and strike structure they need and accept that the listed market is what discovers the price. The listed market discovers the price. The OTC market hedges the volume.
The Frac Spread: Mont Belvieu Minus Henry Hub
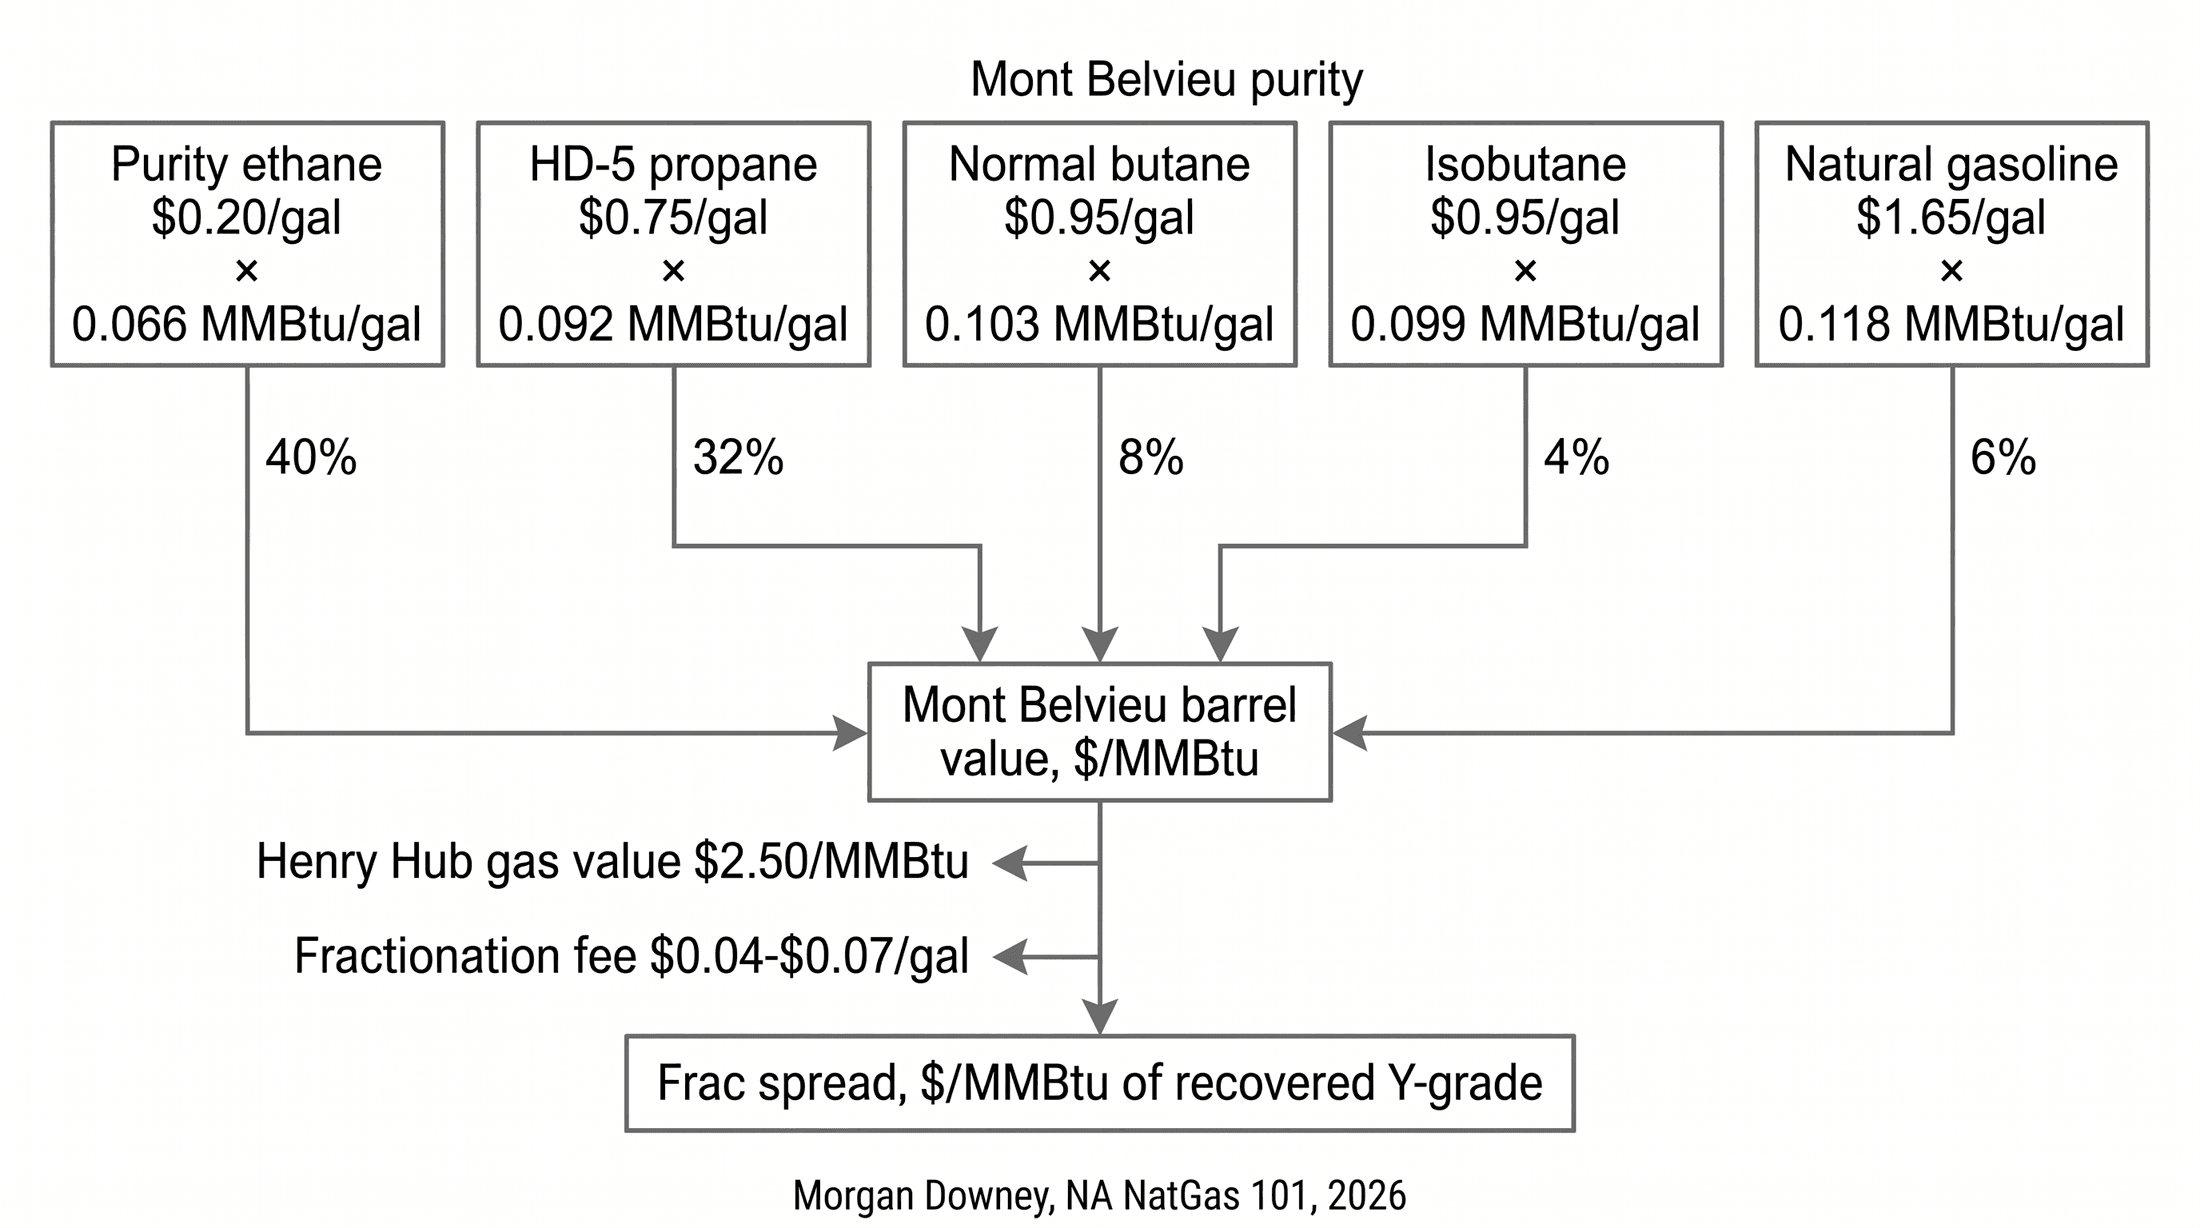
The frac spread is the per-MMBtu margin between the Mont Belvieu NGL barrel value and the Henry Hub gas value, weighted by typical Y-grade composition and adjusted for fractionation costs and shrinkage. The spread is the gross margin a gas processor or producer captures by recovering the NGL components from the wet gas stream rather than leaving them in the residue methane at heating value. The arithmetic is published in roughly the same form by every midstream operator and producer hedging desk in the country, with small differences in the assumed Y-grade composition, the assumed processing fees, and the assumed shrinkage factor.
The starting point is the heating value of each pure component, expressed in MMBtu per gallon. Ethane carries roughly 0.066 MMBtu per gallon. HD-5 propane carries roughly 0.092 MMBtu per gallon. Normal butane carries roughly 0.103 MMBtu per gallon. Isobutane carries roughly 0.099 MMBtu per gallon. Natural gasoline carries roughly 0.118 MMBtu per gallon. The conversion factor turns a cents-per-gallon liquid price into a dollars-per-MMBtu equivalent that can be compared against Henry Hub on a common heating-value basis.
The Y-grade composition assumed in the standard frac spread calculation is roughly 40 percent ethane, 32 percent propane, 8 percent normal butane, 4 percent isobutane, 6 percent natural gasoline, and the remaining 10 percent allocated to fuel and shrinkage. The composition varies by basin: Marcellus wet-core Y-grade runs ethane-heavy, Permian Y-grade runs more evenly distributed, Eagle Ford condensate-window Y-grade runs pentanes-plus heavy. The standard composition is a basin-averaged anchor for the calculation that an operator with a specific basin position adjusts to reflect actual recovery.
The per-MMBtu Mont Belvieu barrel value is the volume-weighted product of the five purity-product prices and the heating-value conversions. The per-MMBtu Henry Hub gas value is the front-month NYMEX NG settlement applied to the same heating volume. The fractionation tolling fee, typically $0.04 to $0.07 per gallon at Mont Belvieu under standard processing agreements (covered in Chapter 9), converts to dollars per MMBtu using the same heating-value framework. Subtracting Henry Hub and the tolling fee from the Mont Belvieu barrel value produces the per-MMBtu frac spread.
A representative 2024 calculation, using Mont Belvieu purity ethane at $0.20 per gallon, HD-5 propane at $0.75 per gallon, butanes at $0.95 per gallon, natural gasoline at $1.65 per gallon, and Henry Hub at $2.50 per MMBtu, produces a frac spread of roughly $4 to $7 per MMBtu of recovered Y-grade depending on the specific composition mix and basin reference. The post-2010 historical range has run from roughly $2 per MMBtu in compressed conditions to above $10 per MMBtu in periods when Henry Hub gas prices were near or below $2 per MMBtu and Mont Belvieu purity ethane and HD-5 propane carried substantial premiums against gas-equivalent value.
The frac spread is the producer’s incentive to recover NGLs rather than reject them. When the spread compresses, processors run in ethane rejection mode and the marginal ethane stays in the residue gas at heating value (covered in Chapter 9 and Chapter 18). When the spread is wide, full recovery captures the full barrel value across all five purity products. The volume swing between fully recovered and partially rejected operating mode shifts US ethane production by the 200,000 to 400,000 barrels per day range that Chapter 18 described, with the swing visible in monthly EIA data when Henry Hub trades through periods of unusual strength relative to Mont Belvieu purity ethane.
CME Group lists a standardized frac spread futures contract designed to function as a financial hedge for the producer’s gross margin exposure. The contract references a basket of Mont Belvieu purity-product prices against Henry Hub on a fixed Y-grade composition, with monthly settlement against the underlying index components. The contract’s liquidity has run thinner than the producer-side hedging volume implied by the underlying margin exposure, with most producer hedging executed through component-level OTC swaps on the individual Mont Belvieu purity products and Henry Hub futures rather than through the standardized frac spread instrument. The frac spread is the gas plant’s gross margin on a single page of arithmetic.
The Crude Differential: NGLs as a Percentage of WTI
NGL prices in the US market have a historical relationship to WTI crude oil that operates through the substitute-feedstock and substitute-fuel markets at each component’s primary demand outlet. Each of the five purity products prices as a characteristic percentage of WTI on a per-barrel basis, with the percentage varying around its long-run anchor in response to shifts in the substitute markets and in regional supply-demand balances.
Ethane runs at the lowest crude differential, in the range of 15 to 35 percent of WTI on a per-barrel basis. The low ratio reflects the lowest heating value of the five components and the narrowest demand outlet: the US Gulf Coast steam cracker fleet sets the marginal ethane price, with the LPG export market for ethane operating as the second-tier outlet through the dedicated VLEC fleet. In the post-2014 period, US ethane production has run substantially in excess of domestic cracker capacity, and the ethane export market has cleared the surplus at progressively lower percentages of WTI as global cracker takers have negotiated against the alternative of US ethane rejection back into the residue gas stream.
Propane runs at 45 to 65 percent of WTI in normal conditions. Propane has broader competing outlets than ethane: residential heating against No. 2 heating oil, petrochemical feedstock against naphtha at the propane dehydrogenation units in China, autogas and forklift fuel as a transportation outlet, and global LPG export against Saudi CP and the Argus Far East Index. The mid-50s percentage held through most of the post-2014 era, with seasonal premiums in the November-through-March winter heating peak and seasonal compression in the April-through-October shoulder periods.
Normal butane runs at 60 to 75 percent of WTI. Butane has gasoline-blendstock value tied directly to RBOB gasoline prices in the winter months when EPA Reid Vapor Pressure specifications allow blending, and butadiene-feedstock value at the Texas and Louisiana butadiene units in the petrochemical market.
Isobutane runs at 65 to 80 percent of WTI. The dominant demand is alkylation feedstock at refineries (covered in Chapter 18), where isobutane prices through the alkylate gasoline blendstock value, which in turn prices at a small premium to RBOB. Refinery isobutane demand runs steady year-round.
Natural gasoline runs at 80 to 100 percent of WTI. Natural gasoline has gasoline-blendstock value and diluent value for Western Canadian heavy oil, with the Canadian diluent demand pricing the marginal barrel close to par with WTI because the diluent is essentially light oil blended into the heavy oil pool destined for US Gulf Coast refineries.
The crude differential ratios shift with the underlying substitute markets. Cold winter heating peaks pull propane higher against WTI through the heating oil arbitrage. Tight global naphtha markets pull propane higher through the Asian petchem swing. Constraints in the US ethane export market pull ethane lower because domestic cracker demand sets the floor. Each component prices through its own substitute. Each substitute writes its own line on the WTI ratio.
Forward Curves and Seasonality by Product
Each Mont Belvieu purity product trades on its own forward curve. The shapes of the five curves are different, set by the seasonality of the underlying demand market and the storage cost of carry against the spot price.
The propane forward curve runs in mild contango through summer, with storage carry pricing the back of the curve at a premium to the prompt month while heating demand is absent. Entering September and October, the curve shifts. The November-through-January propane strip prints at a steep premium to the rest of the calendar in normal years, reflecting the residential heating peak and the inventory draw across the Mid-Continent and Northeast retail network. In years with structurally tight inventories, such as the late-2013 setup that fed the January 2014 Conway spike, the November-January premium widens into a steep backwardation that prices the spot month substantially above the back of the curve.
The butane forward curve runs the opposite seasonal pattern. Summer butane caverns at Mont Belvieu fill in the April-through-September period, when Reid Vapor Pressure specifications exclude butane from the gasoline pool and the cavern operators absorb the marginal barrel at storage rates. Winter butane prints at a substantial premium to summer as the gasoline pool absorbs the blended volume in the November-through-March window, when RVP specifications relax to 13 to 15 psi.
Ethane forward curves run relatively flat across the calendar year. The Gulf Coast cracker fleet’s ethane demand is steady year-round, with the only meaningful seasonality coming from cracker maintenance turnaround schedules concentrated in the second and fourth calendar quarters. Ethane curve shape responds primarily to ethane export economics (the relative pull from the long-term VLEC takers) and to the frac spread (the swing into and out of ethane rejection at the upstream gas plants). Periods of heavy cracker turnaround activity produce shallow contango as physical demand softens; periods of strong export pull and high frac spreads produce shallow backwardation.
Natural gasoline curves track WTI closely on the back of the diluent and gasoline-blending demand structure. Modest seasonal premium appears in the fall and winter months when Western Canadian bitumen blending volumes ramp into the refinery turnaround season at US Gulf Coast and Midwest plants. Isobutane curves run flat across the calendar year, with no consistent seasonal pattern beyond the underlying alkylate demand from the refinery alkylation units, which itself runs steady year-round.
The mixed seasonal pattern across the five products produces a complex forward-pricing structure for any producer with exposure to all of Y-grade. A producer that hedges only Henry Hub and only WTI captures none of the seasonal structure embedded in the Mont Belvieu purity-product curves. A producer that hedges the frac spread as a basket compresses the seasonal exposure into a single forward instrument but loses optionality on the individual component shapes. A producer that hedges each purity product separately captures the full seasonal information but pays for the complexity in dealer bid-offer and ticket-by-ticket execution. Five products. Five curves. One barrel.
Cracker Economics: Ethylene Minus Ethane
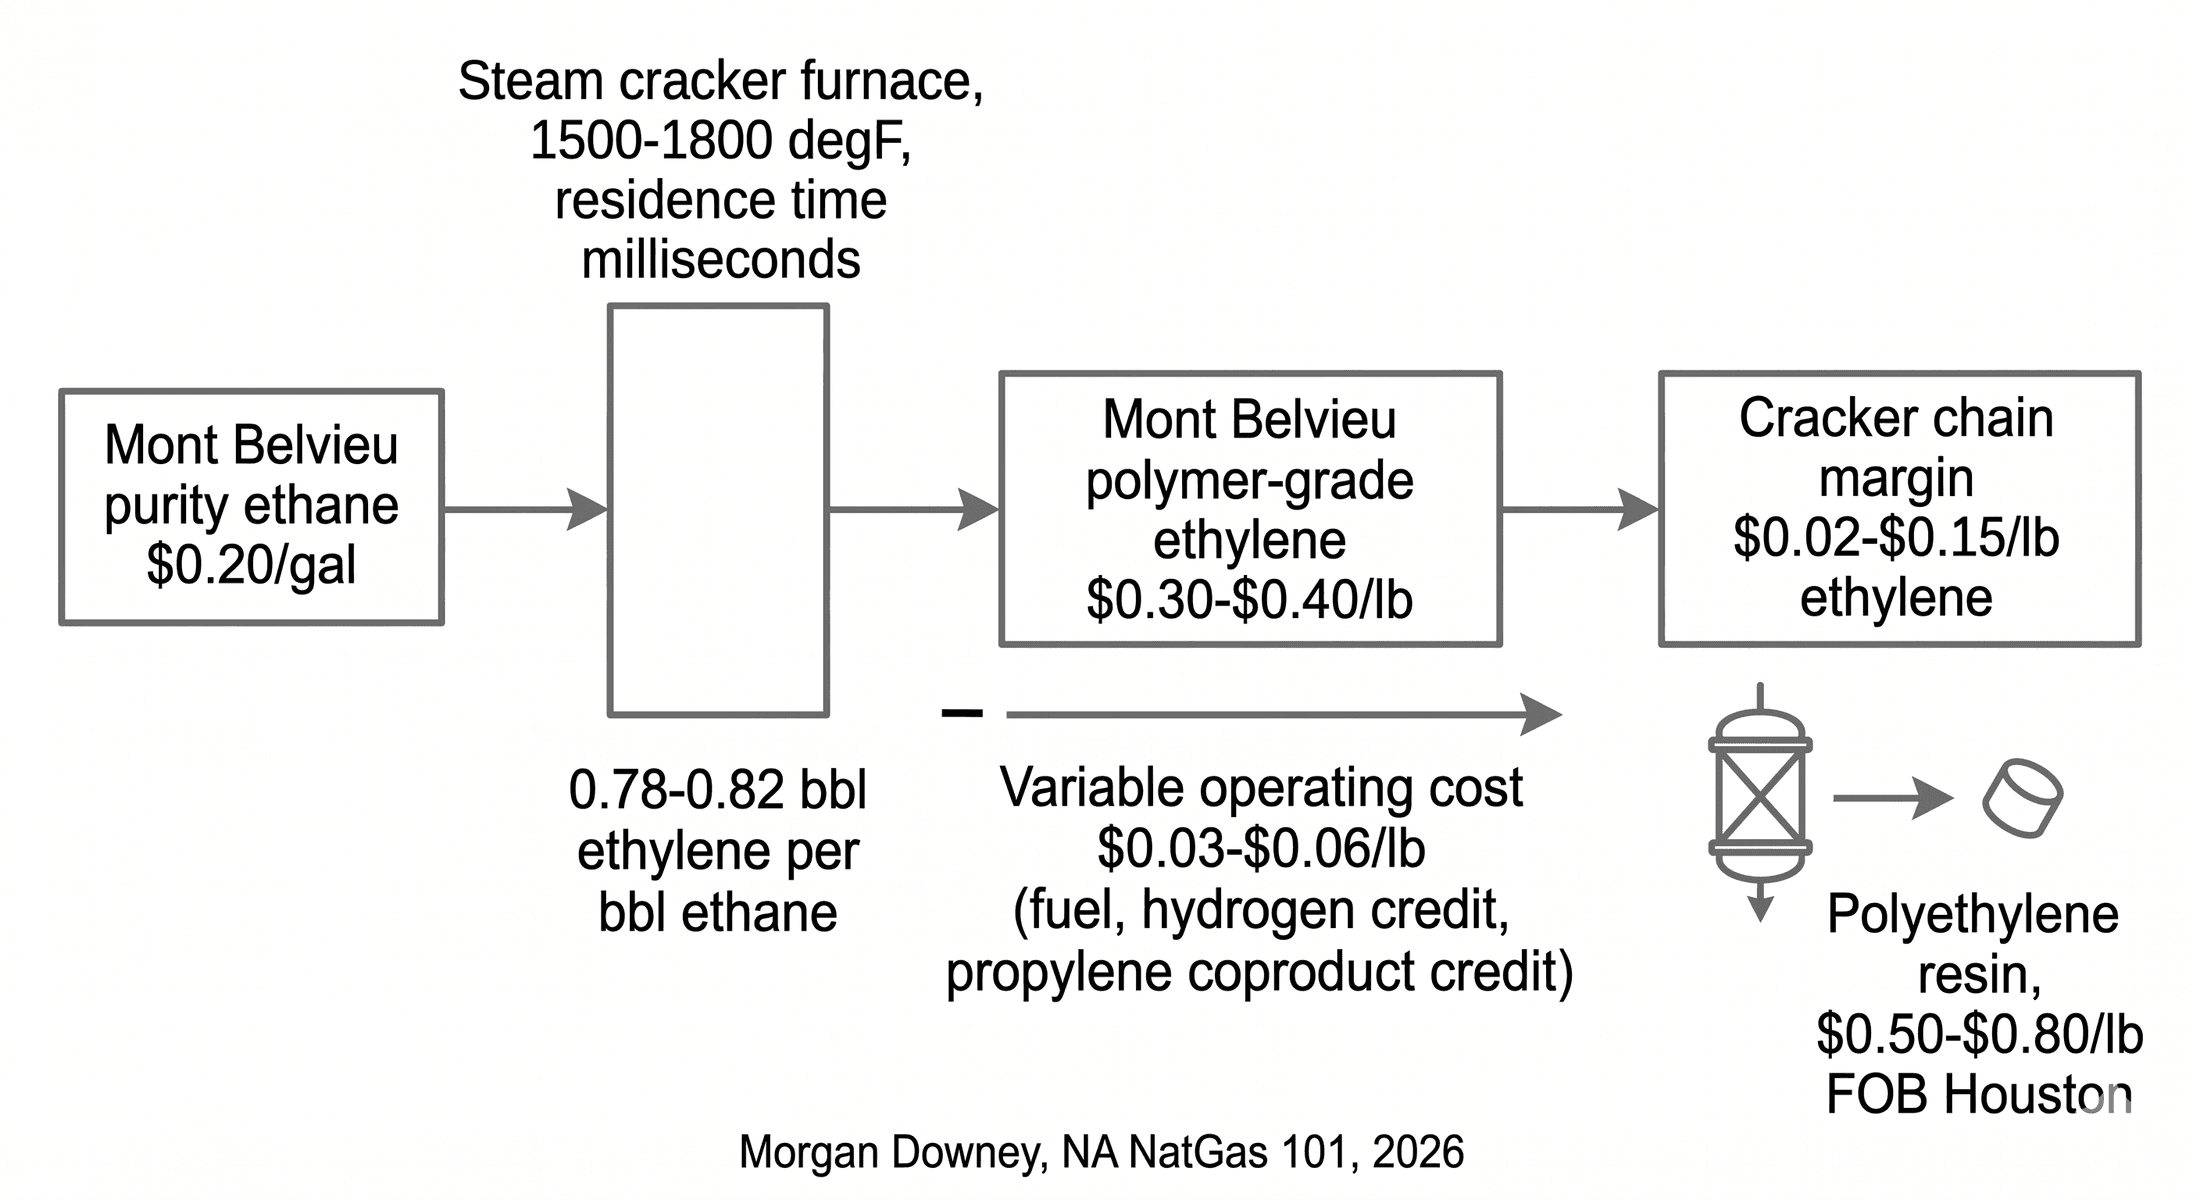
The Gulf Coast steam cracker fleet’s economic logic runs on the ethylene-minus-ethane spread, often called the C2 chain margin. Polymer-grade ethylene at Mont Belvieu, assessed daily by OPIS and Argus, is the principal output. Purity ethane at Mont Belvieu is the principal input. The cracker margin is ethylene price minus ethane price minus variable operating cost, where the variable cost includes plant fuel, hydrogen recovery byproduct credit, propylene and other coproduct credits, and the shrinkage between the ethane feedstock barrel and the ethylene product barrel.
The ethane-to-ethylene shrinkage is set by the cracker furnace yield. One barrel of ethane feedstock produces roughly 0.78 to 0.82 barrels of ethylene depending on furnace severity, residence time, and cracker design. Naphtha crackers, by comparison, produce roughly 0.30 to 0.35 barrels of ethylene per barrel of naphtha feedstock, with a heavier coproduct slate (propylene, butadiene, pyrolysis gasoline, fuel oil) that the ethane cracker does not produce in the same volumes. The yield difference is the dominant reason ethane crackers run as the lowest-cost ethylene producers in the global market when ethane is cheap relative to crude.
A representative chain margin calculation in 2024 conditions: Mont Belvieu polymer-grade ethylene at $0.30 to $0.40 per pound (roughly $1,400 to $1,800 per metric ton) and Mont Belvieu purity ethane at $0.20 per gallon (roughly $0.30 per pound on a converted basis) generates a gross margin in the range of $0.05 to $0.20 per pound of ethylene, before variable operating cost. Variable operating cost runs in the range of $0.03 to $0.06 per pound of ethylene at a typical large Gulf Coast cracker, leaving a net cash margin of roughly $0.02 to $0.15 per pound on the chain.
The chain margin supports US ethane crackers as the lowest-cost producers in the global ethylene market. The margin also drives the US polyethylene export trade. Roughly 40 percent of US polyethylene production exports under long-term and spot contracts to global resin buyers, with the destinations concentrated in Latin America, China, Southeast Asia, and Europe. The export economics are driven by the transatlantic and trans-Pacific landed cost difference between US polyethylene produced from $0.20 per gallon ethane and naphtha-cracker polyethylene produced from $700 per metric ton naphtha at European and Asian competitors.
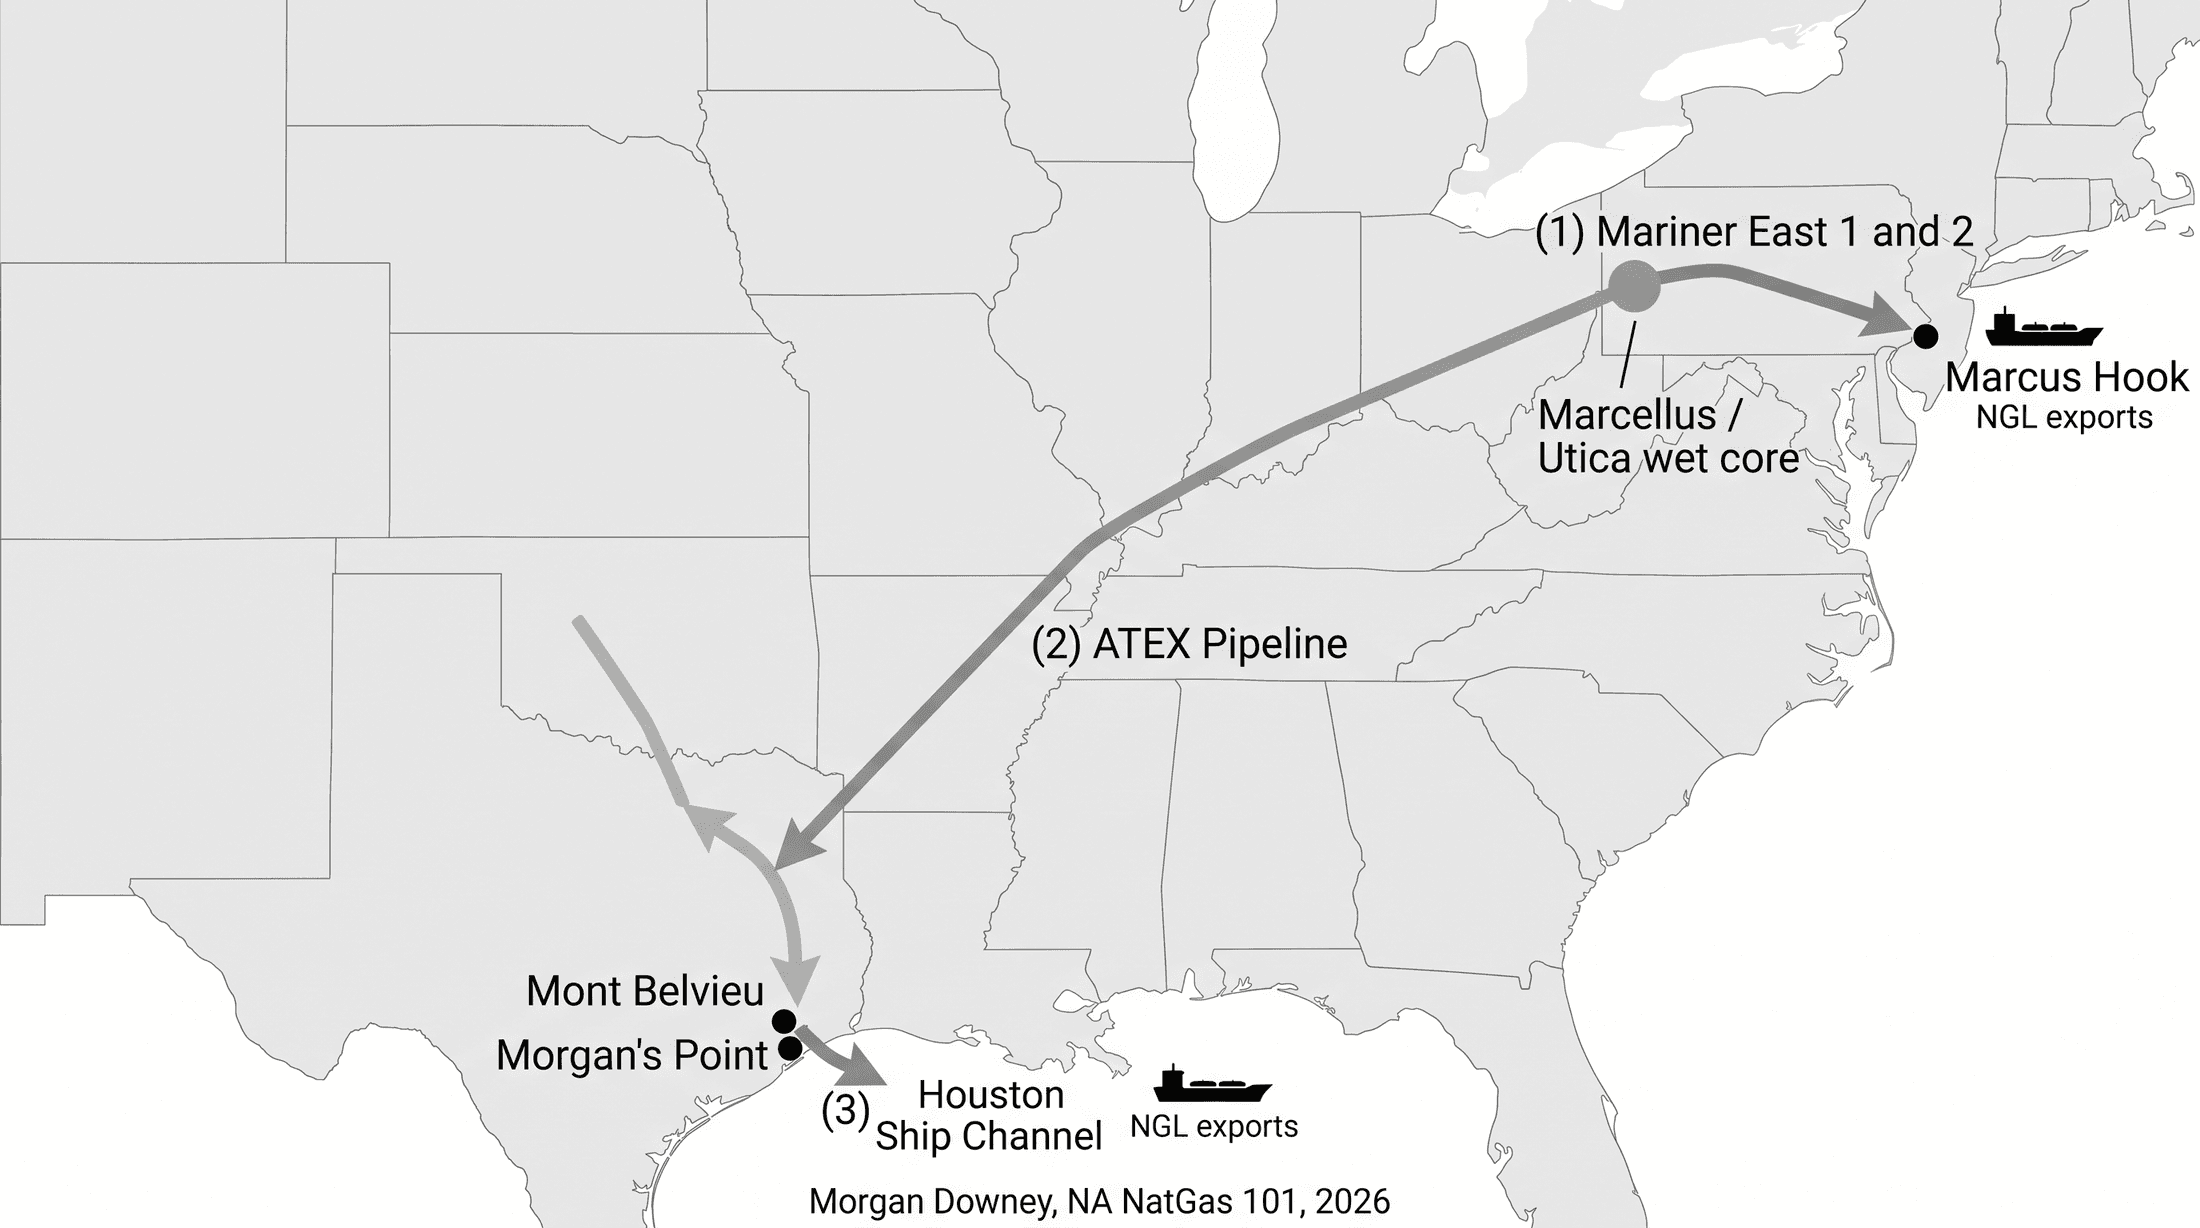
The cracker margin and the polyethylene export margin together create the demand pull that ties Mont Belvieu purity ethane prices to the global plastic resin market. The chain runs from a Marcellus wet-core gas well, through a cryogenic recovery train at a MarkWest plant in southwestern Pennsylvania, through the ATEX pipeline to Mont Belvieu, through a Targa or Enterprise deethanizer column, through the ethylene pipeline to a Dow cracker at Freeport, through a polyethylene reactor, into a polyethylene resin pellet loaded onto a container ship at the Port of Houston bound for São Paulo or Shanghai. The margin is the difference, less the cost of running the cracker.
The Global LPG Market and US Export Pricing
The global LPG market trades against three benchmark price references that anchor the international cargo trade. The Saudi Aramco Contract Price for propane and butane is the historical anchor. Saudi Aramco publishes the monthly CP at the start of each month for propane and butane separately, with the price set by the Saudi Aramco marketing organization based on its assessment of global market conditions. The CP is the contractual reference for the bulk of Asian and European term LPG sale and purchase agreements, with most term contracts pricing as Saudi CP plus or minus a fixed differential per metric ton.
The Argus Far East Index is the daily spot benchmark for LPG cargoes delivered to the Japan-Korea-Taiwan market. AFEI is calculated from a daily survey of cargo offers, bids, and completed transactions on a delivered Far East CFR basis. The Argus Northwest Europe LPG assessment is the parallel daily spot benchmark for cargoes delivered into the Antwerp-Rotterdam-Amsterdam petrochemical and retail complex, calculated on a delivered Northwest Europe CIF basis. The two Argus benchmarks together provide the daily mark-to-market for cargo trading and the spot pricing reference for shorter-term contracts that do not run on Saudi CP.
US LPG export pricing operates as the FOB Mont Belvieu or FOB Houston price plus the freight and the destination market discount or premium. The arbitrage relationship for an Asian-bound cargo: Saudi CP or AFEI minus US Gulf-to-Asia freight (typically $90 to $130 per metric ton on a Very Large Gas Carrier through the Panama Canal) minus the Mont Belvieu-to-Houston pipeline tariff equals the FOB Mont Belvieu price net of arbitrage margin. The arbitrage relationship for a Northwest European cargo: Argus NWE LPG minus US Gulf-to-Europe freight (typically $60 to $90 per metric ton) minus the Mont Belvieu-to-Houston tariff equals the FOB Mont Belvieu price net of arb margin.
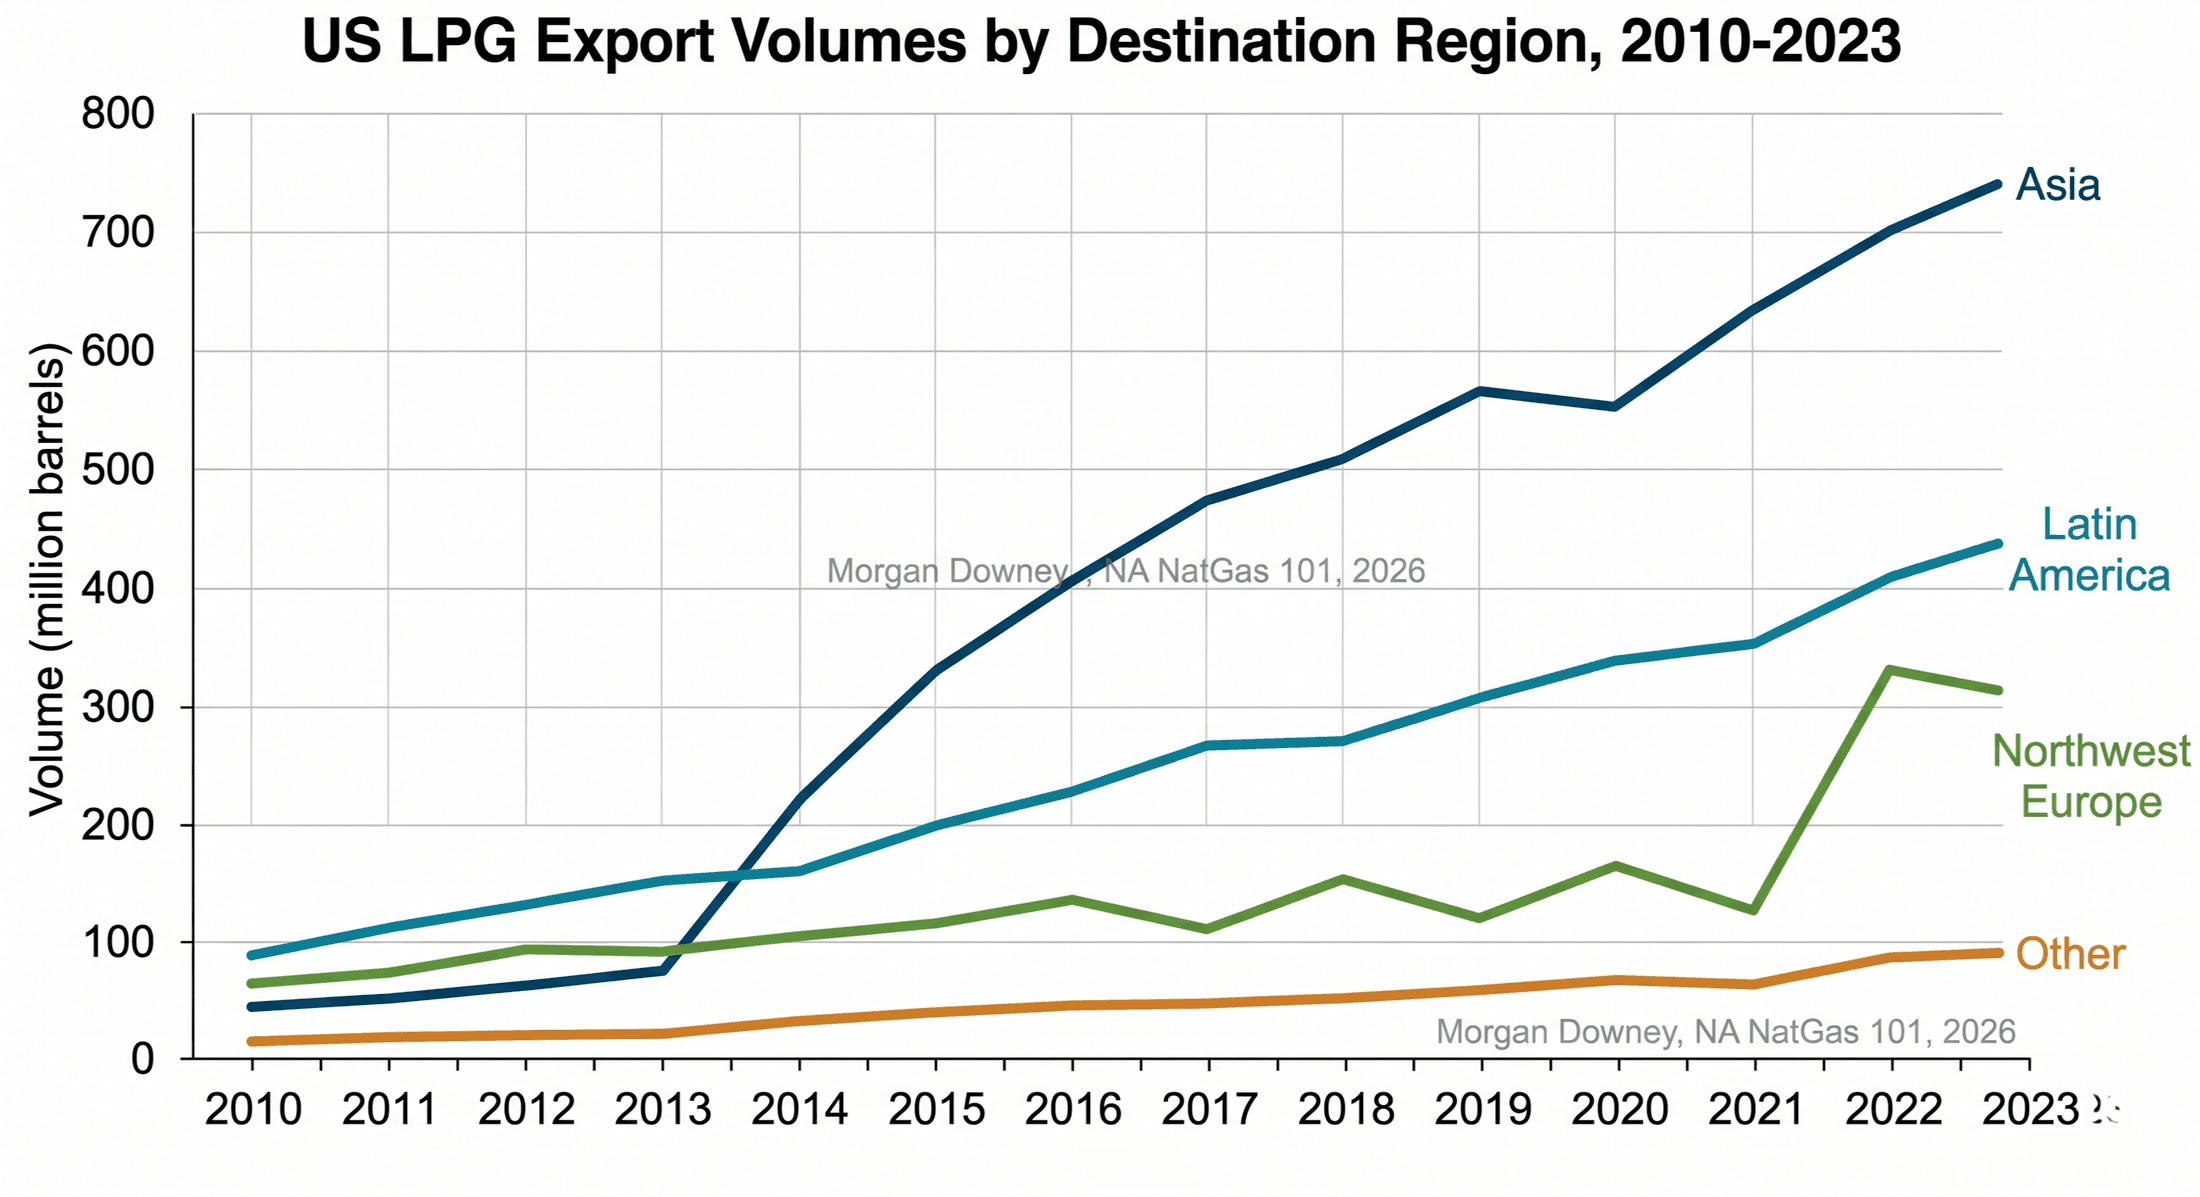
When the arbitrage closes, with destination market premium below the freight cost, US Gulf Coast cargoes redirect to inland US storage or to Latin American destinations. When the arbitrage opens wide, with destination premium far above freight, Gulf Coast loading rates ramp and cargoes prioritize the higher-netback destination. The 2022 European LPG demand surge during the European energy crisis pulled US Gulf Coast cargoes preferentially to Northwest Europe at premiums that produced record export economics for Enterprise Products Partners, Energy Transfer, and Targa Resources through the back half of that year.
Producers, crackers, marketers, and retailers each hedge their portion of the price stack on top of the underlying market. Producers hedge wellhead NGL exposure by selling forward the OPIS Mont Belvieu purity-product strip on ICE swaps, typically covering 12 to 24 months of expected production at a layered execution schedule. Crackers hedge the chain margin by buying forward Mont Belvieu purity ethane and selling forward Mont Belvieu polymer-grade ethylene, locking in the spread regardless of either commodity’s outright price move. Retail propane distributors hedge winter-delivery purchases by buying forward Mont Belvieu HD-5 propane swaps for the November-through-March delivery window, often combined with embedded options on volume against degree-day weather indexes. Refiners hedge alkylate margins by selling forward RBOB and buying forward Mont Belvieu isobutane. Each hedge is the visible commercial expression of the underlying price relationship the chapter has described.
The 2022 European LPG Surge and Saudi CP
Saudi Aramco published its February 2022 Contract Price for propane on Tue Feb 1, 2022, at $775 per metric ton, against a 2017-to-2020 historical average closer to $400 per metric ton. Russia invaded Ukraine on Thu Feb 24, 2022. The European LPG market, which had run on a mix of Russian rail-delivered cargoes, North Sea production, and waterborne imports from the Middle East and the United States, lost the Russian rail volumes within weeks as European buyers self-sanctioned ahead of formal sanctions packages.
Saudi Aramco published the March 2022 propane CP on Tue Mar 1, 2022, at roughly $895 per metric ton, an increase of $120 per metric ton in a single month. Argus Northwest Europe LPG cargoes traded above $1,000 per metric ton through the spring of 2022 as European petrochemical and retail buyers competed against Asian buyers for Middle East and US Gulf Coast volumes. The premium over the Argus Far East Index opened to historic levels, pulling US Gulf Coast cargoes to Northwest Europe at netback economics that had not existed in the prior decade of US LPG export trade.
Enterprise Products Partners, Energy Transfer, and Targa Resources reported export volumes and netback margins through 2022 that reset operator-level expectations for what the Gulf Coast LPG export franchise was worth. The Saudi CP propane benchmark peaked near $940 per metric ton in April 2022 before easing through the back half of the year and into 2023. The episode demonstrated that the Mont Belvieu price layer is a North American price that clears against a global price stack and that a distant geopolitical event can reset the floor and ceiling on every US producer’s NGL netback in the space of a quarter.
Chapter 20 picks up at the seasonality and weather layer that drives the demand-side variability in both natural gas and the heating-fuel components of the NGL barrel. The price layer described above is what the seasonal demand transmits through.