Switching and Cross-Commodity Competition
Coal-to-gas dispatch switching at the spark spread, ethane-versus-naphtha at flex-feed steam crackers, propane-versus-heating-oil residential, and the cross-commodity arbitrage that ties gas to power, petrochemicals, and the global oil barrel.

On Thu Apr 19, 2012, the front-month NYMEX Henry Hub natural gas contract settled at $1.907 per MMBtu, the lowest front-month settlement in more than a decade. Powder River Basin coal was clearing the rail-delivered Eastern interconnect at the equivalent of roughly $2.20 to $2.50 per MMBtu after transport, against an in-basin mine-mouth price near $10 to $12 per ton. The dark spread had collapsed. The spark spread had widened. PJM Interconnection, MISO, and the SERC footprint were running combined-cycle gas turbines into the marginal-dispatch slot ahead of subcritical coal units that had operated as baseload generators for 40 years.
The dispatch desks at AEP, Duke, Southern Company, and Dominion ran the same arithmetic each morning. A 7,000 Btu per kWh F-class CCGT at $2 per MMBtu generates electricity at $14 per MWh of fuel cost. A 9,500 Btu per kWh subcritical coal unit at $2.30 per MMBtu generates at $22 per MWh of fuel cost, before SO2 and NOx allowance charges, before variable operating and maintenance differentials, and before the CO2 implicit cost in the regions where it bound. The crossover was not close. It was decisive.
The wave that began that spring continued through the decade. Over 100 gigawatts of US coal-fired generation capacity was retired between 2010 and 2024, the largest single-fuel capacity retirement in the history of the US power grid. The cause was the cross-commodity arbitrage that the chapter develops: gas does not trade in isolation, and the substitute markets are what move the gas price into and out of every demand block.
The Cross-Commodity Grid: Where Gas Competes
Gas competes against a different substitute fuel at each major demand block. In power generation, gas competes against coal in the dispatch stack, against nuclear baseload that runs price-insensitive, and against renewables whose marginal cost is zero (Chapter 12). In petrochemical feedstock, gas competes through ethane and propane against naphtha at the steam cracker (Chapter 19 covered the ethane chain margin; this chapter covers the ethane-vs-naphtha switch). In residential heating, gas competes against heating oil in the rural Northeast, against propane in the inland markets, and against electric heat pumps where the building stock has converted (Chapter 13). In industrial steam and process heat, gas competes against No. 6 residual fuel oil and No. 2 distillate at the dual-fuel boilers that retain switching capability, and against coal at the cement kilns and steel mills that have not converted.
The cross-commodity arbitrage runs through the spread relationships that price each pair. The spark spread (gas-fired generation margin) and the dark spread (coal-fired generation margin) clear the power-dispatch substitution. The cracker chain margin against the naphtha chain margin clears the petrochemical feedstock substitution. The propane-to-heating-oil parity clears the residential heating substitution at the dual-fuel customer. The industrial fuel-switch curve clears the dual-fuel boiler substitution. Each spread embeds the substitute fuel’s wholesale price, the conversion efficiency of the appliance, the local delivery cost, and the regulatory overlay (emissions allowances, methane fees, fuel-oil sulfur specifications). When the substitute price falls relative to gas, the substitute pulls demand off the gas system. When the substitute price rises, gas pulls demand back. The substitute prices are not stable references. They move on their own market dynamics, transmitted to gas through the spread relationships.
Coal-to-Gas Switching at the Power Dispatch Margin
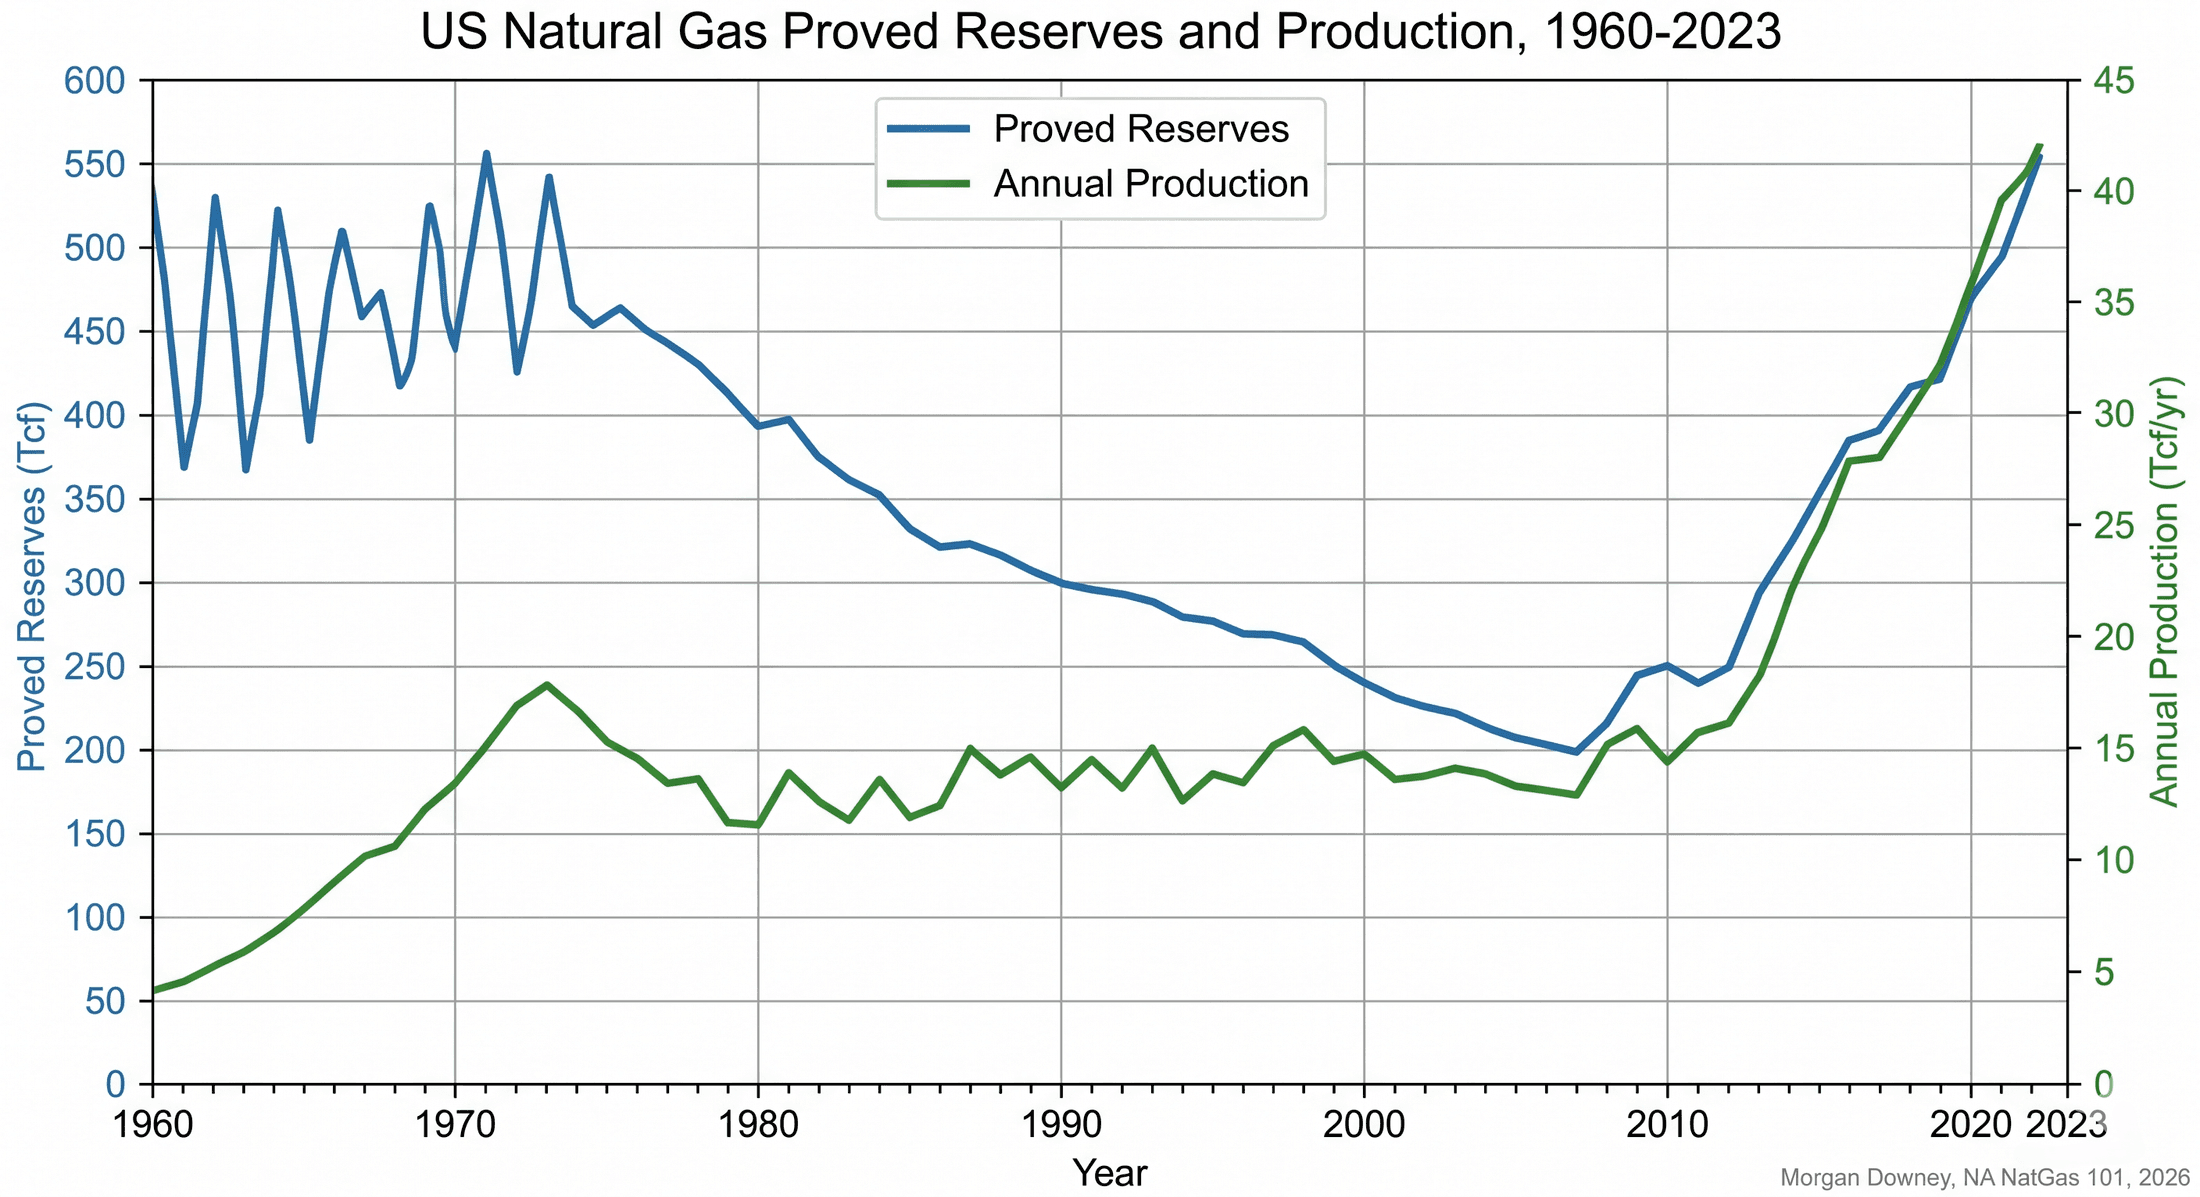
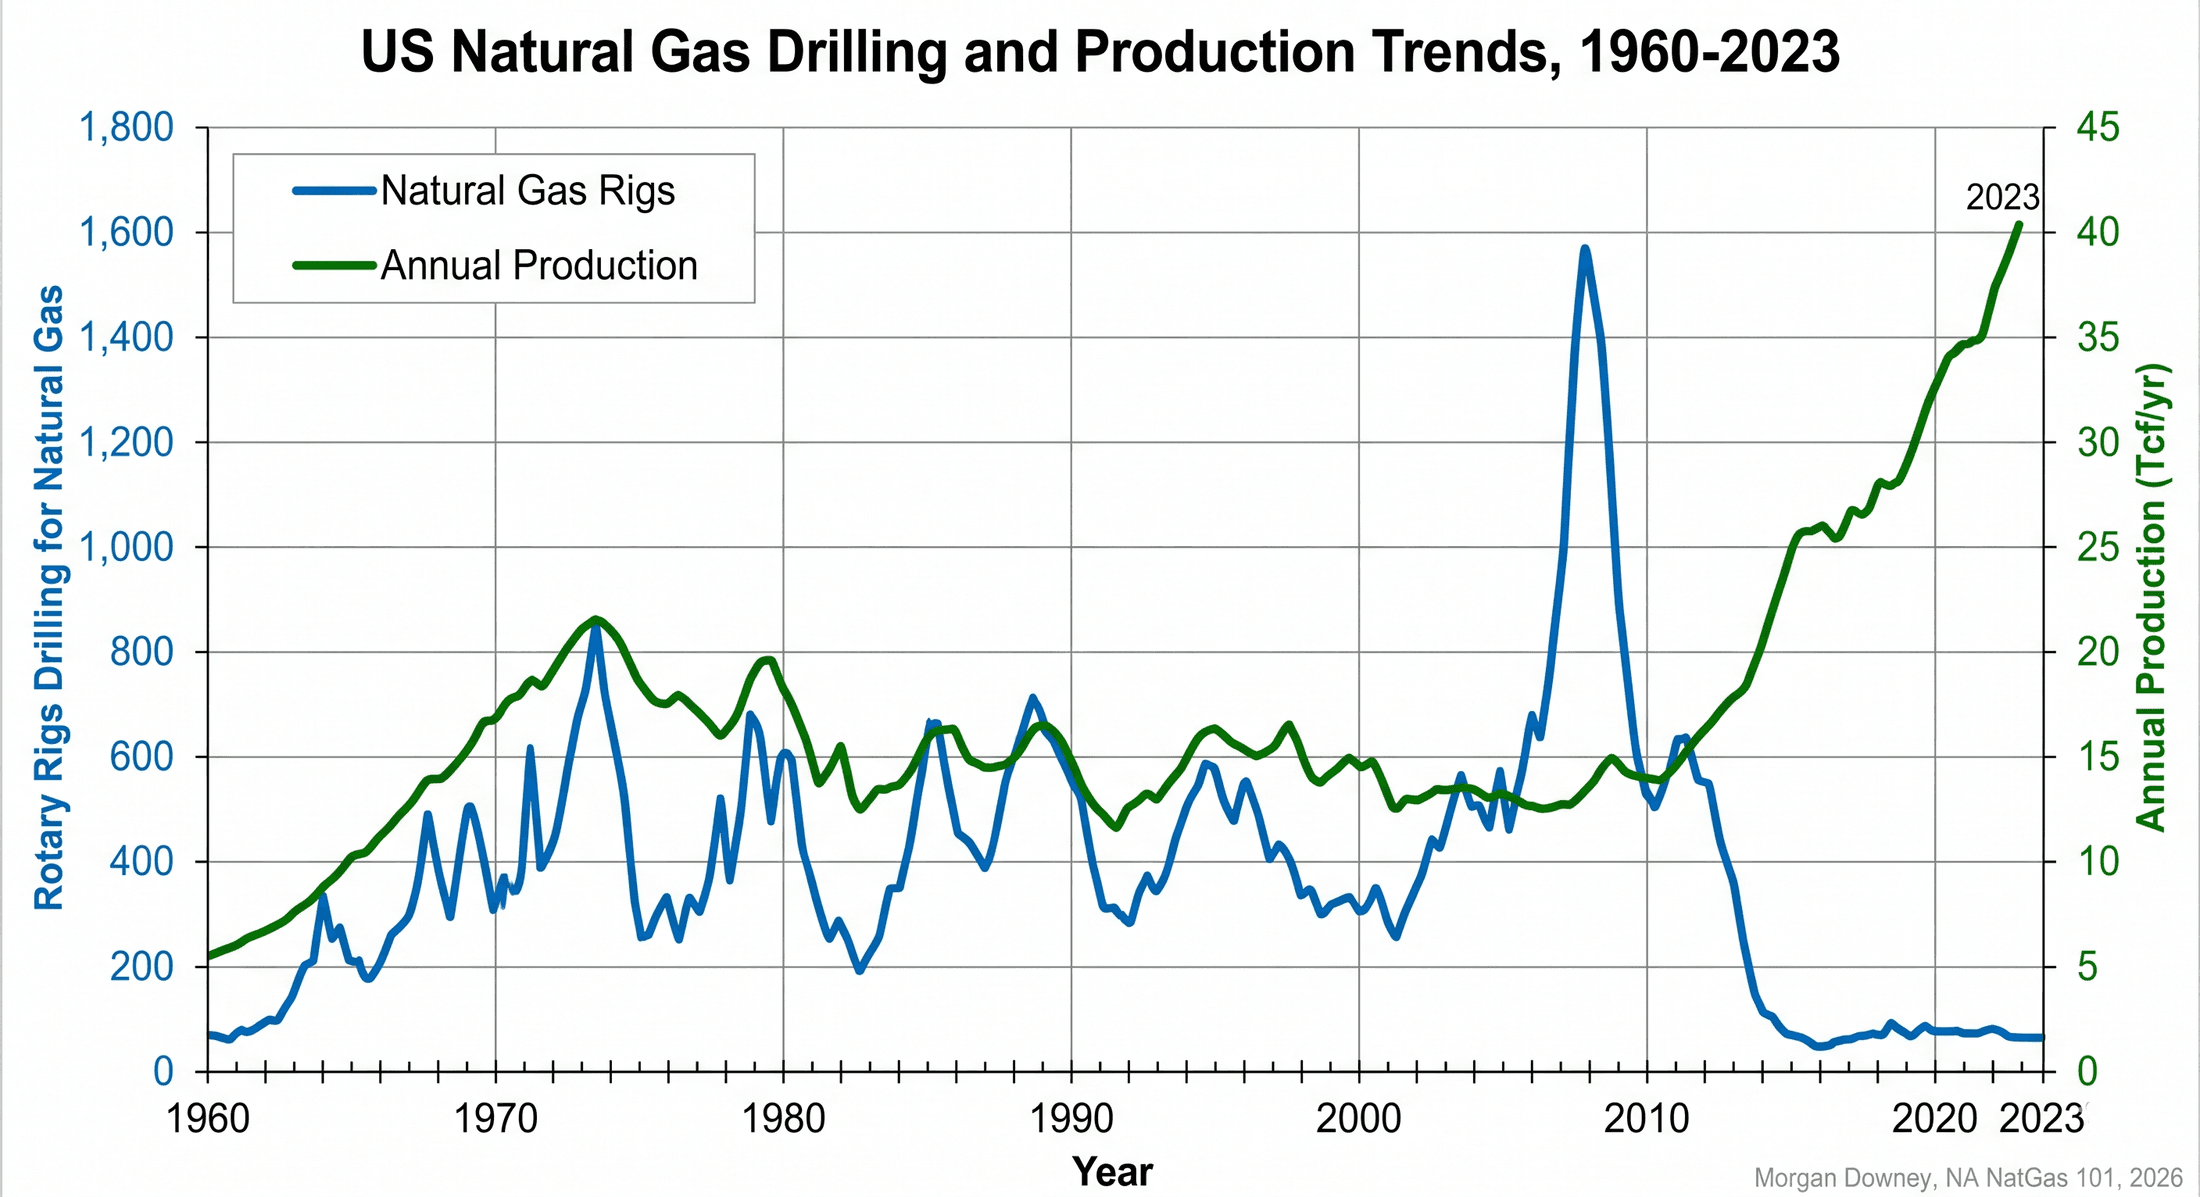
The dominant cross-commodity story in US gas over the past 15 years has been the coal-to-gas switch in the power dispatch stack. Chapter 12 introduced the spark spread and the dark spread; this section develops the switching arithmetic that drove the structural shift. The switch is visible from two directions. From here it is a gas demand story. From inside the power market it is a reordering of the dispatch stack, which Power 101 develops in its own right.
The variable cost of generating one MWh of electricity from a 7,000 Btu per kWh F-class combined-cycle gas turbine, at a Henry Hub price of $3.00 per MMBtu, is roughly $21 per MWh of fuel cost. The variable cost from a 9,500 Btu per kWh subcritical coal plant burning Powder River Basin coal at an effective $0.70 per MMBtu mine-mouth equivalent, with rail transport to the Eastern interconnect adding roughly $1.50 to $2.00 per MMBtu, is roughly $20 to $26 per MWh of fuel cost depending on the rail tariff.
The crossover gets layered when the regulatory and operational adjustments are added. SO2 allowance prices under the Cross-State Air Pollution Rule, NOx allowance prices under the Ozone Transport Rule, the CO2 cost in the regions with binding cap-and-trade programs (the Regional Greenhouse Gas Initiative covering eleven Northeast states, California Cap-and-Trade, and Washington’s Climate Commitment Act), and the variable operating and maintenance differentials between coal and gas all enter the dispatch calculation. Coal-fired plants face higher SO2, NOx, and CO2 costs per MWh; gas-fired plants face lower regulatory costs but higher fuel costs per Btu. The all-in switching point moves with the regulatory and the fuel price components together.
In 2008, with Henry Hub above $8 per MMBtu and PRB coal in roughly the $0.50 to $0.70 per MMBtu mine-mouth range, coal was meaningfully cheaper than gas in every US dispatch market on every operating hour. By 2012, with Henry Hub below $3 per MMBtu, gas had moved below coal in PJM, MISO, and SERC dispatch on most operating hours. The switching point in 2024-2025 conditions, with Henry Hub at $2 to $3 per MMBtu and the EPA OOOOb/c methane standards and the IRA Section 60113 Waste Emissions Charge layered on the gas side (Chapter 17), holds gas below coal in nearly every US dispatch market on most operating hours.
The exception runs in winter peak conditions, when Henry Hub spikes above $8 to $10 per MMBtu and coal moves back into the marginal-dispatch position briefly. The August 2022 European crisis pulled the front-month NYMEX Henry Hub above $9 per MMBtu through the late summer trading window, and several US regional dispatch markets ran coal ahead of gas for limited hours during that window. Winter Storm Uri in February 2021 ran a parallel reversal in the southern Plains, with regional gas hub prints above $200 per MMBtu shutting gas-fired generation out of the dispatch stack entirely (Chapter 1, Chapter 12).
The structural side of the story is the retirement that the dispatch arithmetic produced. Over 100 gigawatts of US coal-fired generation capacity was retired between 2010 and 2024 according to EIA Form EIA-860 generator inventory data, leaving the remaining US coal fleet at roughly 175 to 185 gigawatts of capacity by year-end 2024. The IEA Coal Market Report and the EIA Annual Energy Outlook both attribute the bulk of the retirement wave to the gas-price collapse and the resulting dispatch displacement, with environmental compliance costs and the renewable buildout adding a second and third layer to the same trend. The retirement is not reversible at any reasonable timescale. The capacity that left the system did not stay mothballed. It was demolished, decommissioned, and the sites repurposed.
Ethane vs Naphtha at the Flex-Feed Cracker
The global steam cracker fleet operates against two principal feedstocks. Ethane dominates the US Gulf Coast cracker fleet (Chapter 19). Naphtha dominates the Asian and European fleets. Roughly 30 percent of the global cracker fleet operates as flex-feed, with the cracker able to swing between ethane, propane, butane, and naphtha based on relative prices on a unit-of-ethylene-output basis. The flex-feed cracker is the price-discovery mechanism that links the global ethylene market to the cross-commodity decision.
Naphtha is the light end of the crude oil refining slate. The boiling range runs roughly 30 to 200 degrees Celsius. Naphtha is priced in dollars per metric ton or per barrel, and the price tracks Brent crude on a tight relationship. Naphtha typically clears at 90 to 105 percent of Brent on a per-barrel basis, with the precise ratio depending on whether the petrochemical demand pull or the gasoline blendstock pull dominates (naphtha is a primary gasoline blendstock as well as a cracker feedstock). The Mediterranean (CIF Med), Northwest Europe (CIF NWE), and Singapore (FOB) naphtha hubs are the three principal regional pricing references for the cracker fleet’s purchasing decisions.
The flex-feed cracker compares the ethane chain margin at Mont Belvieu (Chapter 19) against the naphtha chain margin at the operator’s local naphtha hub on a common ethylene-output basis. The ethane chain margin runs the Mont Belvieu purity ethane price, plus US Gulf Coast pipeline transport, plus the cracker tolling cost, against the spot ethylene price at Mont Belvieu, Houston Ship Channel, or the export FOB equivalent. The naphtha chain margin runs the regional naphtha price, plus the cracker tolling cost, against the regional ethylene price at the cracker outlet. When ethane on a per-pound-of-ethylene basis is cheap relative to naphtha on the same basis, the flex-feed cracker swings to ethane (where the operator has access to imported US ethane through the very-large ethane carrier fleet covered in Chapter 18) or to propane (where the operator can run propane as a secondary feed). When naphtha is cheap, the cracker swings back.
The Asian flex-feed cracker fleet at Daesan, Yeosu, Onsan, and Singapore maintains substantial ethane and propane import capability for exactly this purpose. The European fleet historically ran on naphtha but added ethane import capability through INEOS at Rafnes (Norway) and Grangemouth (Scotland), Borealis at Stenungsund (Sweden), SABIC at Teesside (UK), and other long-term US ethane buyers (Chapter 18). The cross-Atlantic ethane trade prices through the Mont Belvieu purity ethane assessment, the VLEC freight rate, and the European ethylene price at the receiving cracker.
The 2022 European energy crisis pushed the all-in operating cost of running a European naphtha cracker above the gross margin the cracker could earn on its ethylene output. European crackers consume substantial pipeline gas as utility fuel and to generate process steam. With TTF at 300 EUR per MWh through August and September 2022 (Chapter 14), the gas-utility cost component alone exceeded the per-ton ethylene chain margin a naphtha cracker could capture against US polyethylene imports priced off Mont Belvieu ethane economics. Multiple European cracker operators idled or curtailed capacity through the second half of 2022. Versalis (Eni’s chemicals subsidiary) curtailed its Brindisi cracker through the late summer and announced extended shutdowns at multiple Italian sites. BASF announced permanent restructuring at Ludwigshafen in late October 2022, including the permanent closure of one of its two ammonia plants and a capacity downsizing across the chemical chain. INEOS and Borealis reduced run rates at multiple European sites. Dow announced production curtailments at Terneuzen (Netherlands) and Stade (Germany).
The episode demonstrated the cross-commodity link in real time. Gas at 300 EUR per MWh shut in petrochemical feedstock demand on the European side of the Atlantic, redirected the global ethylene cost curve to the US Gulf Coast (where ethane was clearing at $0.20 to $0.30 per gallon), and pulled US polyethylene exports to historic premium levels through 2022 and into early 2023. Naphtha is not just a chemical feedstock. When gas competes with naphtha at the cracker, gas competes with crude oil through the naphtha-Brent linkage.
Propane vs Heating Oil at the Residential Furnace
The classic US heating-fuel substitution runs across the rural Northeast, Pennsylvania, and parts of the Midwest, where the residential heating market is split between propane (delivered by truck to on-site tanks) and No. 2 heating oil (delivered by truck to on-site tanks). Natural gas serves the urban and suburban heating customer where the local distribution company has built out the pipeline grid; propane and heating oil serve the rural customer where the local distribution company has not. The cross-commodity arbitrage runs at the dual-fuel customer subset and at the appliance-replacement decision the customer makes when the existing furnace fails.
The arithmetic compares the delivered cost per million Btu at the customer’s tank. Propane carries roughly 0.092 MMBtu per gallon (Chapter 19). No. 2 heating oil carries roughly 0.138 MMBtu per gallon. The retail prices at the customer tank typically run higher than the wholesale Mont Belvieu propane and the New York Harbor heating oil futures by a fixed retail markup, with $0.30 to $0.80 per gallon as the typical 2024 retail-to-wholesale spread for both fuels and meaningful regional variation. The customer-tank parity calculation divides the retail price per gallon by the heating value per gallon to convert to dollars per MMBtu, then compares.
Heating oil prices on a wholesale basis are set by the New York Harbor heating oil futures on NYMEX, which in turn track the global distillate market. Heating oil is essentially the same molecule as on-road ULSD diesel and as low-sulfur marine fuel oil. The same refinery cut clears into all three markets, with sulfur specifications and dye additives differentiating the products at the rack. The heating oil price tracks the diesel and ULSD market tightly, which in turn tracks the global distillate complex anchored on Singapore gasoil and Northwest Europe gasoil. When global diesel demand pulls distillate prices up, heating oil follows, and the propane-vs-heating-oil parity at the rural Northeast tank shifts in favor of propane.
The propane retail customer in Vermont or Maine facing $4 per gallon heating oil and propane at $2.50 per gallon retail will choose the cheaper Btu-equivalent delivered fuel where the customer has installed appliances for both, or stay with the existing appliance if the conversion cost (a new furnace at $4,000 to $8,000 plus installation labor) exceeds the present-value savings. The substitution is mostly long-run, mediated by appliance turnover. In the short run, the propane and heating oil markets are coupled through the customer subset that runs dual-fuel appliances or that has recently converted, and the cross-commodity arbitrage runs through that subset on each cold morning. The wholesale propane forward curve at Mont Belvieu prices the relationship indirectly through the propane-to-WTI ratio (Chapter 19), which itself reflects the broader distillate-to-crude relationship.
Industrial Steam and Dual-Fuel Boilers
Industrial process heat covered in Chapter 13 (food and beverage, paper, glass, cement, steel direct-reduced-iron, refining) runs principally on gas in the modern US industrial fleet, with limited switching capability. Most US industrial gas appliances installed since 2000 are gas-only. The capital cost of dual-fuel capability has not been justified by the substitute-fuel optionality at the levels of switching frequency that the post-2010 gas-price stability has produced. A 50 MMBtu per hour industrial boiler with dual-fuel capability costs meaningfully more than a gas-only equivalent and requires on-site oil storage, a separate burner train, and ongoing maintenance, with the incremental capital and operating cost rarely repaid by the optionality value over the equipment’s useful life under post-2010 gas-price assumptions.
A residual minority of US industrial sites retain dual-fuel boilers with No. 6 residual fuel oil or No. 2 distillate as backup. These sites switch to oil only on emergency curtailment days when interruptible gas service is cut (Chapter 16) or on the rare gas-price spike when the wholesale gas price exceeds the wholesale oil price on a Btu-equivalent basis. The Northeast paper mill fleet, the Northeast and Mid-Atlantic chemical processing fleet, and a handful of industrial cogeneration sites carry dual-fuel capability for exactly this purpose.
The 2022 European industrial fuel switching was the largest demonstration of the dual-fuel mechanic in modern times. European industrial sites with dual-fuel capability switched to fuel oil and even to coal in some categories through the back half of 2022 to escape the 300 EUR per MWh TTF gas price. Chinese industrial gas-to-coal switching ran a parallel mechanic. High-priced Chinese LNG imports backed out gas demand in industrial steam, urea production, and ceramic processing in favor of coal-fired alternatives that the Chinese government had been gradually phasing out under earlier air-quality programs. The cross-commodity shift propagated globally and reset the floor on the industrial-gas demand curve for several quarters.
PDH and Methanol-to-Olefins: Propane and Gas as Petchem Feedstocks Beyond the Cracker
Beyond the ethane and naphtha cracker, two additional petrochemical pathways consume gas-chain feedstocks. Propane dehydrogenation (PDH) converts propane directly to propylene, bypassing the steam cracker. PDH units at the US Gulf Coast (Enterprise Products Partners’ Mont Belvieu PDH-1 and PDH-2 units, Enterprise PDH-3 commissioned in 2025, and the Targa Resources PDH unit at Galena Park) and a much larger Chinese PDH fleet consume the bulk of US propane export volume that the Asian and European markets pull through the Saudi CP and Argus Far East Index arbitrage that Chapter 19 covered. Chinese PDH propane demand sourced from US Gulf Coast exports runs roughly 600,000 to 800,000 barrels per day in 2024 conditions, the largest single demand source for US propane exports.
The PDH-vs-cracker substitution prices through the propane-to-naphtha ratio at the propylene-output level. When propane is cheap relative to naphtha on a propylene-yield basis, PDH pulls market share from the steam cracker, which historically produced propylene as a coproduct of the ethylene cracker process. When naphtha is cheap, the cracker captures the propylene share. The post-2014 US shale propane glut produced a sustained PDH economic advantage that Chinese operators built capacity to capture, with new Chinese PDH units coming online through 2018, 2020, 2022, and 2024.
Methanol-to-olefins (MTO) is a third pathway that converts methanol (produced from natural gas through steam-methane reforming, Chapter 13) to ethylene and propylene at dedicated MTO units, primarily in China. The MTO pathway prices through the natural gas to methanol to olefins chain margin and competes against both the ethane and the naphtha cracker on a unit-of-olefin-output basis. MTO economics have been marginal through most of the post-2018 period because the methanol price has not stayed low enough to clear the chain on a sustained basis. The pathway exists as a swing source of olefin capacity that can run when gas is exceptionally cheap and shut down when gas is not. Chinese MTO operators including Wison Engineering, Ningxia Baofeng Energy, and Jiangsu Sailboat Petrochemical run the largest unit capacities globally.
The 2022 European Crisis as the Canonical Case
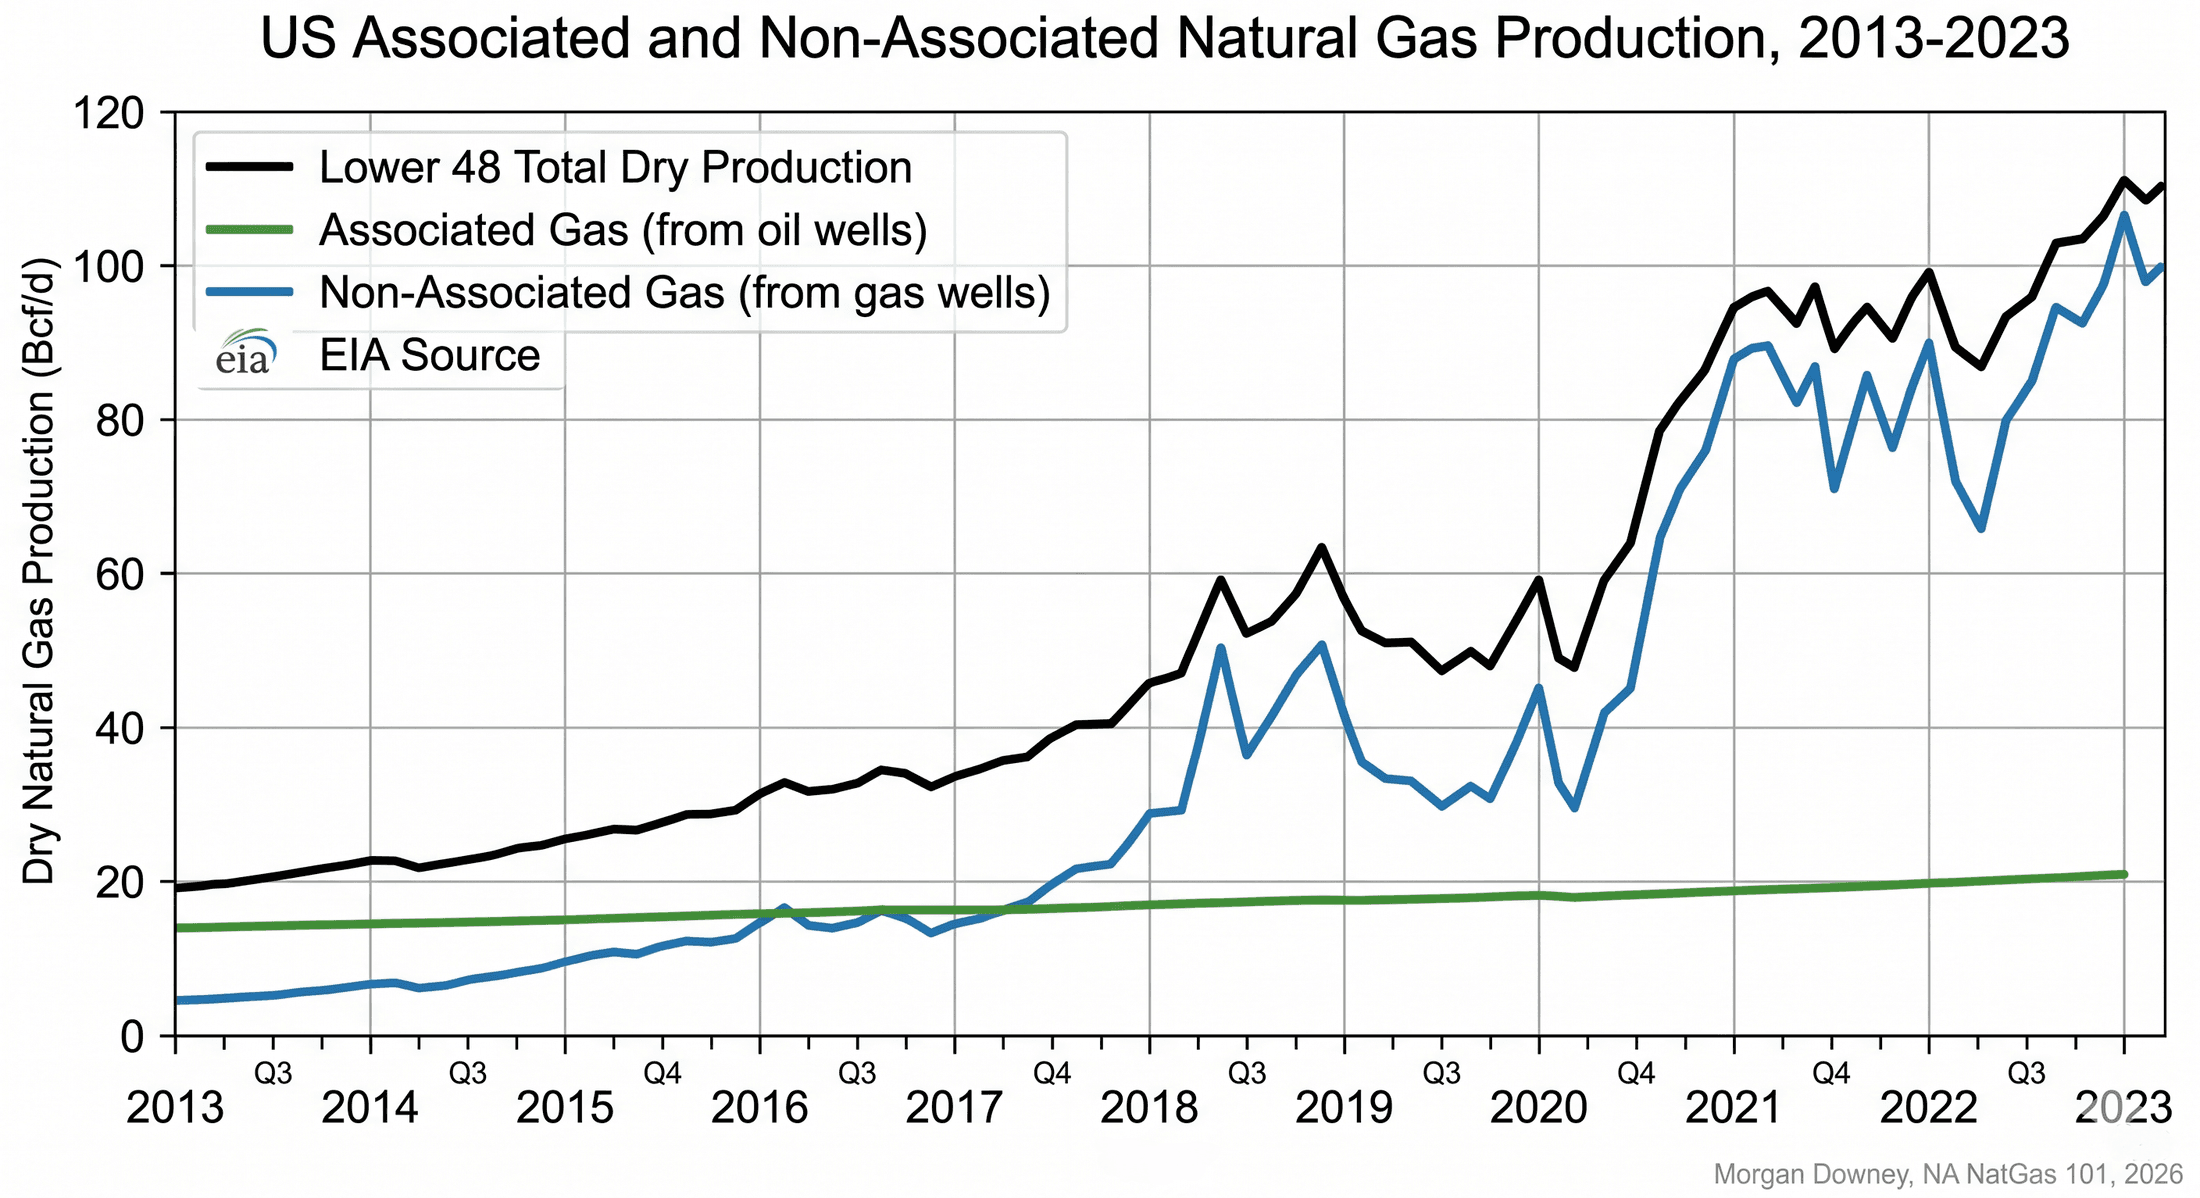
Through the second half of 2022, the European energy crisis ran every cross-commodity switch in the chapter simultaneously. TTF month-ahead gas reached a settlement peak of approximately 339 EUR per MWh on Fri Aug 26, 2022. The cross-commodity response ran through six channels at once.
Power-sector substitution: European utilities ran coal-fired generation at maximum capacity and idled gas-fired CCGTs where physically possible, contributing to a temporary reversal of the post-2008 European coal-to-gas trend. Germany temporarily extended the operating life of coal plants scheduled for retirement under the national coal exit. The UK ran emergency coal capacity through the winter 2022-2023 heating season at sites that had already been mothballed.
Petrochemical substitution: European naphtha crackers curtailed or idled (covered in section 3 above). The capacity loss was not fully restored once gas prices normalized through 2023 and 2024. Versalis announced permanent closure of the Brindisi cracker in 2024, redirecting Italian olefin demand to imports.
Industrial substitution: dual-fuel boilers switched to fuel oil and coal where regulation permitted (covered in section 5 above).
Residential substitution: European households reduced thermostat settings under government coordination programs and accelerated heat pump installation. The IEA estimated roughly 3 million heat pumps installed across the EU in 2022, against approximately 2 million per year in the 2018-2020 baseline. The 2023 and 2024 installation rates moderated but stayed above the pre-crisis baseline, locking in a structural reduction in residential gas demand.
Fertilizer substitution: European ammonia plants curtailed (Chapter 13). Yara, BASF, and CF Industries each idled European ammonia capacity through 2022 and 2023, with global nitrogen fertilizer pricing resetting against the resulting supply shortfall. The European ammonia capacity loss redirected global nitrogen fertilizer trade flows and pulled US ammonia exports to record levels.
LNG substitution: European LNG imports tripled to fill the Russian pipeline gap, with US Gulf Coast cargoes preferentially redirected to Northwest Europe (Chapter 14). The collective response demonstrated that the cross-commodity link runs in both directions. Gas-market shocks transmit through the substitute markets when the substitute markets exist and the operational flexibility allows the switch. The same link transmits substitute-market shocks back into the gas market when the substitute markets are themselves disrupted.
The Vermont Tank Truck on Tue Jan 9, 2018
On Tue Jan 9, 2018, a propane delivery truck pulled into a residential driveway in Rutland County, Vermont, after a six-day arctic outbreak that had pushed New England morning lows below minus 20 degrees Fahrenheit through the prior week. The Boston Algonquin Citygate gas basis had cleared above $30 per MMBtu over Henry Hub through the prior week (Chapter 15). Northeast distillate inventories had pulled below seasonal-norm levels. Retail No. 2 heating oil at the Vermont customer-tank had cleared above $3.20 per gallon.
The propane tank truck delivered at $2.85 per gallon retail. On a Btu-equivalent basis, the propane delivery cleared at roughly $30.98 per MMBtu against heating oil at roughly $23.19 per MMBtu, leaving the propane customer paying a premium for the convenience of the existing appliance over the cheaper-Btu alternative the dual-fuel customer would have selected if the appliance permitted. The arbitrage that the textbook describes runs the other direction in many years, but in early January 2018 the Northeast distillate market was the cheaper fuel by Btu and the propane customer was paying the spread for not converting. The cross-commodity link is two-sided. The customer who burned heating oil that morning saved roughly $7 per MMBtu against the propane customer. The customer who burned propane that morning paid the cost of an appliance decision made years earlier.
Chapter 1 argued that gas behaves differently from oil because of storage, basis, captive infrastructure, demand seasonality, demand lock-in, and methane emissions. The nineteen chapters that followed operationalized that argument inside the gas system. Section VI extended the argument across the boundary, with the natural gas liquids chain (Chapters 18 and 19) handing off the wet-gas value through Mont Belvieu, the seasonal cycle (Chapter 20) handing off the calendar, and the substitute markets (this chapter) handing off the price at every demand block. Gas is its own market, anchored on the storage cycle, the basis hubs, and the infrastructure constraints. Gas is also a coupled market, joined to crude oil through coal at the power-dispatch margin, through naphtha at the cracker, through heating oil at the furnace, and through fuel oil at the boiler. Both statements are true. The natural gas market trades against itself and against everything else at the same time. The largest of those couplings, the one running through the power dispatch stack, has a volume of its own: Power 101 picks up where this chapter stops, at the point where the gas price stops being a fuel cost and becomes an electricity price.