Pricing Hubs and Basis
Henry Hub as the benchmark, the basis-point archipelago of US pipeline pricing, and the spreads that carry most of the information in the gas market.
On Mon Oct 9, 2018, an Enbridge T-South natural gas pipeline ruptured near Shelley, British Columbia, roughly 13 kilometers north of Prince George. The 36-inch line is the trunk that carries Western Canadian gas south to the Pacific Northwest. The escaping gas ignited; the resulting fireball was visible for miles. Automatic block valves isolated the rupture within minutes. Enbridge took both T-South lines out of service and restored partial flow on the surviving 30-inch line within ten days. Combined Canadian export capacity to Washington and Oregon dropped by roughly 1.4 Bcf/d through the back half of 2018.
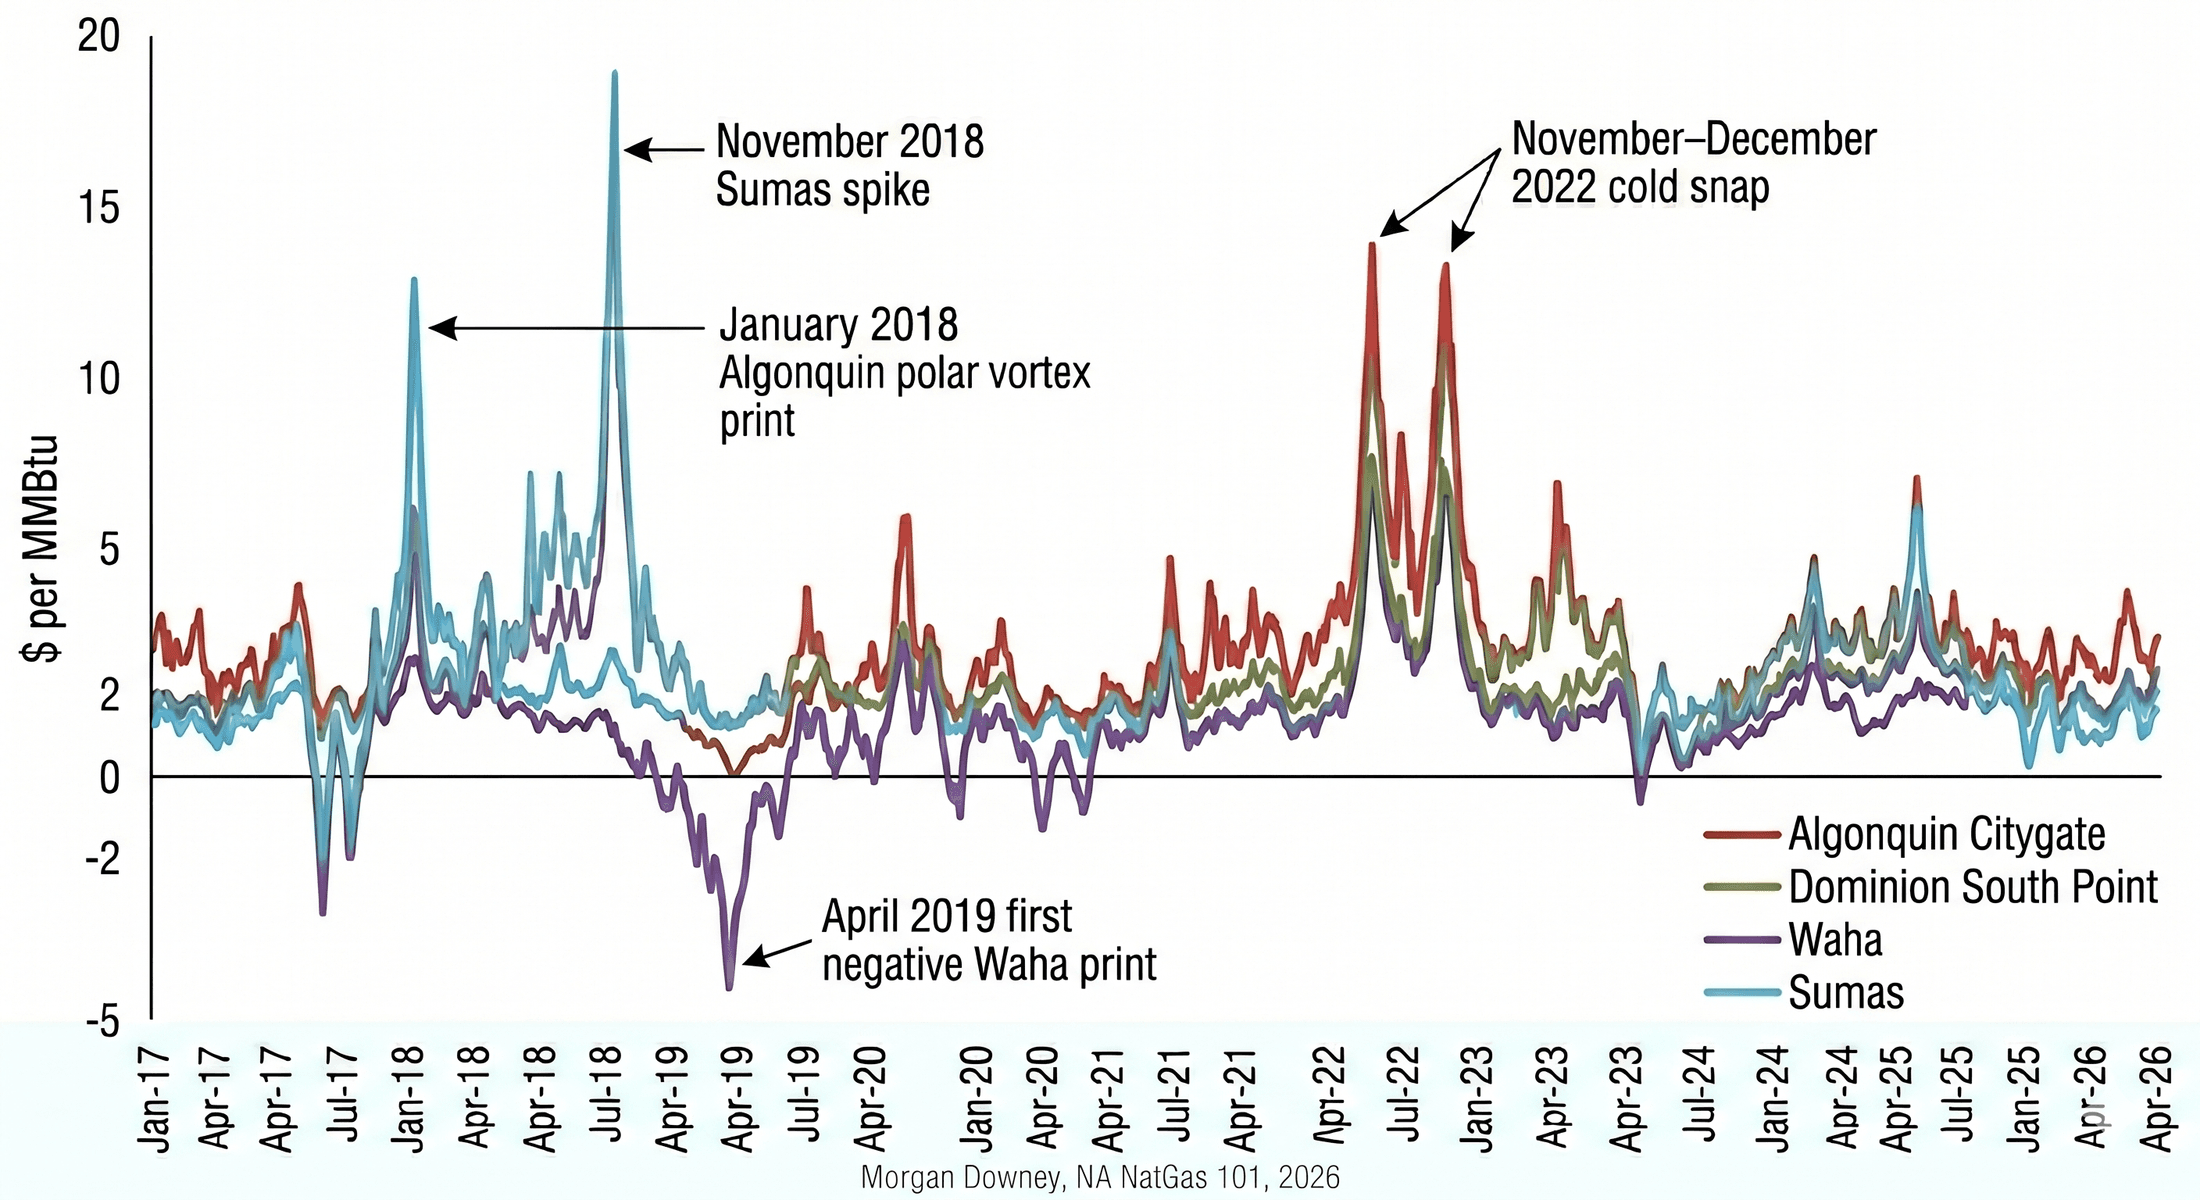
The Sumas hub is the metering point on the US side of the international border, the Cascades crossing where Westcoast Energy’s T-South line delivers into Williams Northwest Pipeline. On the Friday before the rupture, Sumas day-ahead gas had cleared near $2.20 per MMBtu, a few cents above Henry Hub. By the third week of November, with cold weather building across the Pacific Northwest and only partial T-South flow restored, Sumas day-ahead jumped to $40, then $80. On Tue Nov 27, 2018, Sumas printed roughly $200 per MMBtu day-ahead against a Henry Hub front-month near $4.40. Sumas basis to Henry Hub, normally measured in cents, hit $195.
Pacific Northwest LDCs that bought gas at Sumas under daily-index contracts faced bills they could not pass through to retail customers under existing tariff terms. Avista Corporation, Cascade Natural Gas, and Puget Sound Energy each filed cost-recovery applications with their state regulators in the months that followed. Henry Hub was unmoved.
The chapter that follows is the price layer underneath every North American gas trade. Henry Hub is the reference. Basis is the location. The calendar curve is the time.
Henry Hub: The Physical Hub and the Financial Benchmark
Henry Hub is a physical pipeline interconnect in Erath, Vermilion Parish, in the southern Louisiana coastal plain, roughly 20 miles south of Lafayette. The hub is operated by Sabine Pipe Line LLC, which historically owned the 1,065-mile Sabine mainline running from south Louisiana to the Texas Gulf Coast. Sabine Pipe Line was for decades a Chevron midstream subsidiary; in November 2014, Chevron sold the company to EnLink Midstream, and the asset has since changed hands through subsequent midstream consolidation. The hub itself is a cluster of metering and interconnect points where roughly a dozen interstate and intrastate pipelines tie into the Sabine mainline.
The interconnect roster has shifted over three decades with corporate reorganizations and pipeline reroutes, but the canonical list includes Acadian, Bridgeline, Columbia Gulf Transmission, Gulf South Pipeline, Jefferson Island Storage and Hub, Sea Robin Pipeline, Southern Natural Gas, Tennessee Gas Pipeline, Texas Eastern Transmission, Texas Gas Transmission, Transcontinental Gas Pipe Line (Transco), Florida Gas Transmission, and the Sabine mainline itself. Physical throughput averages roughly 1.8 Bcf/d under normal flow conditions, a meaningful share of any one connecting pipeline but small relative to the roughly 100 Bcf/d that the United States consumes.
The volumetric significance of Henry Hub is not what made it the benchmark. The interconnect topology did. The hub sits at the meeting point of pipelines drawing supply from the legacy southern Louisiana producing region, the Texas Gulf Coast, the offshore federal waters, and the Mid-Continent through the Gulf South and Texas Gas connections. Demand-side connectivity reaches Florida through Florida Gas Transmission, the Northeast through Texas Eastern, Tennessee Gas Pipeline, and Transco, the Midwest through Columbia Gulf, and the Southeast through Southern Natural Gas. The hub is the single most-connected molecule junction in the US gas grid. The New York Mercantile Exchange selected it for that reason in 1990.
NYMEX listed the first natural gas futures contract on Tue Apr 3, 1990. The specification: 10,000 MMBtu of pipeline-quality natural gas, monthly delivery periods running through the calendar year and twelve months forward, extended on a rolling basis, with physical delivery at Henry Hub for the small share of contracts that go to settlement and financial cash settlement for the rest. The last trading day of each contract month is the third business day before the first calendar day of the delivery month. The contract has traded continuously since April 1990. Volume has grown from a few thousand contracts per day in the early 1990s to over 400,000 contracts per day on a typical session in 2024. The strip extends about ten years forward through listed monthly contracts, with substantial liquidity through the prompt three calendar years and progressively thinner liquidity in years four through ten.
The contract’s pricing power extends well beyond the financial market. The Federal Energy Regulatory Commission, the EIA, the IEA, and every sell-side gas research desk reference the NYMEX NG settlement as “the gas price.” LNG sale and purchase agreements are indexed to it. Cross-border imports from Canada and exports to Mexico settle against it. The Henry Hub cash market, the daily physical price that the Inside FERC and Platts indexes report, tracks the front-month futures within a few cents on most days.
Cash and futures convergence is enforced by the physical delivery option in the contract. A trader holding a long futures position into the last trading day can stand for delivery; a trader holding a short position into the last trading day can deliver physical gas at Henry Hub against the position. The economic threat of physical delivery anchors the cash-futures basis at the front of the curve. In practice, the physical delivery option is exercised on a small share of total open interest, but the threat of exercise is sufficient to enforce convergence. The arbitrage between cash and futures at Henry Hub is one of the cleanest in any commodity market, and the resulting transparency is what makes the hub useful as a benchmark for everything downstream.
The hub itself is unremarkable. A few hundred yards of metering equipment behind a chain-link fence in a Louisiana swamp prices the marginal gas molecule for the entire Western Hemisphere.
The Basis-Point Archipelago
Henry Hub is the reference. The regional hubs are the location. Basis at any given hub is defined as the cash price at that hub minus the Henry Hub cash price for the same delivery period, expressed in dollars per MMBtu. A positive basis means the hub trades at a premium to Henry Hub. A negative basis means a discount. The basis at each hub on each delivery day is the visible price signal for the locational scarcity of pipeline capacity into and out of that point.
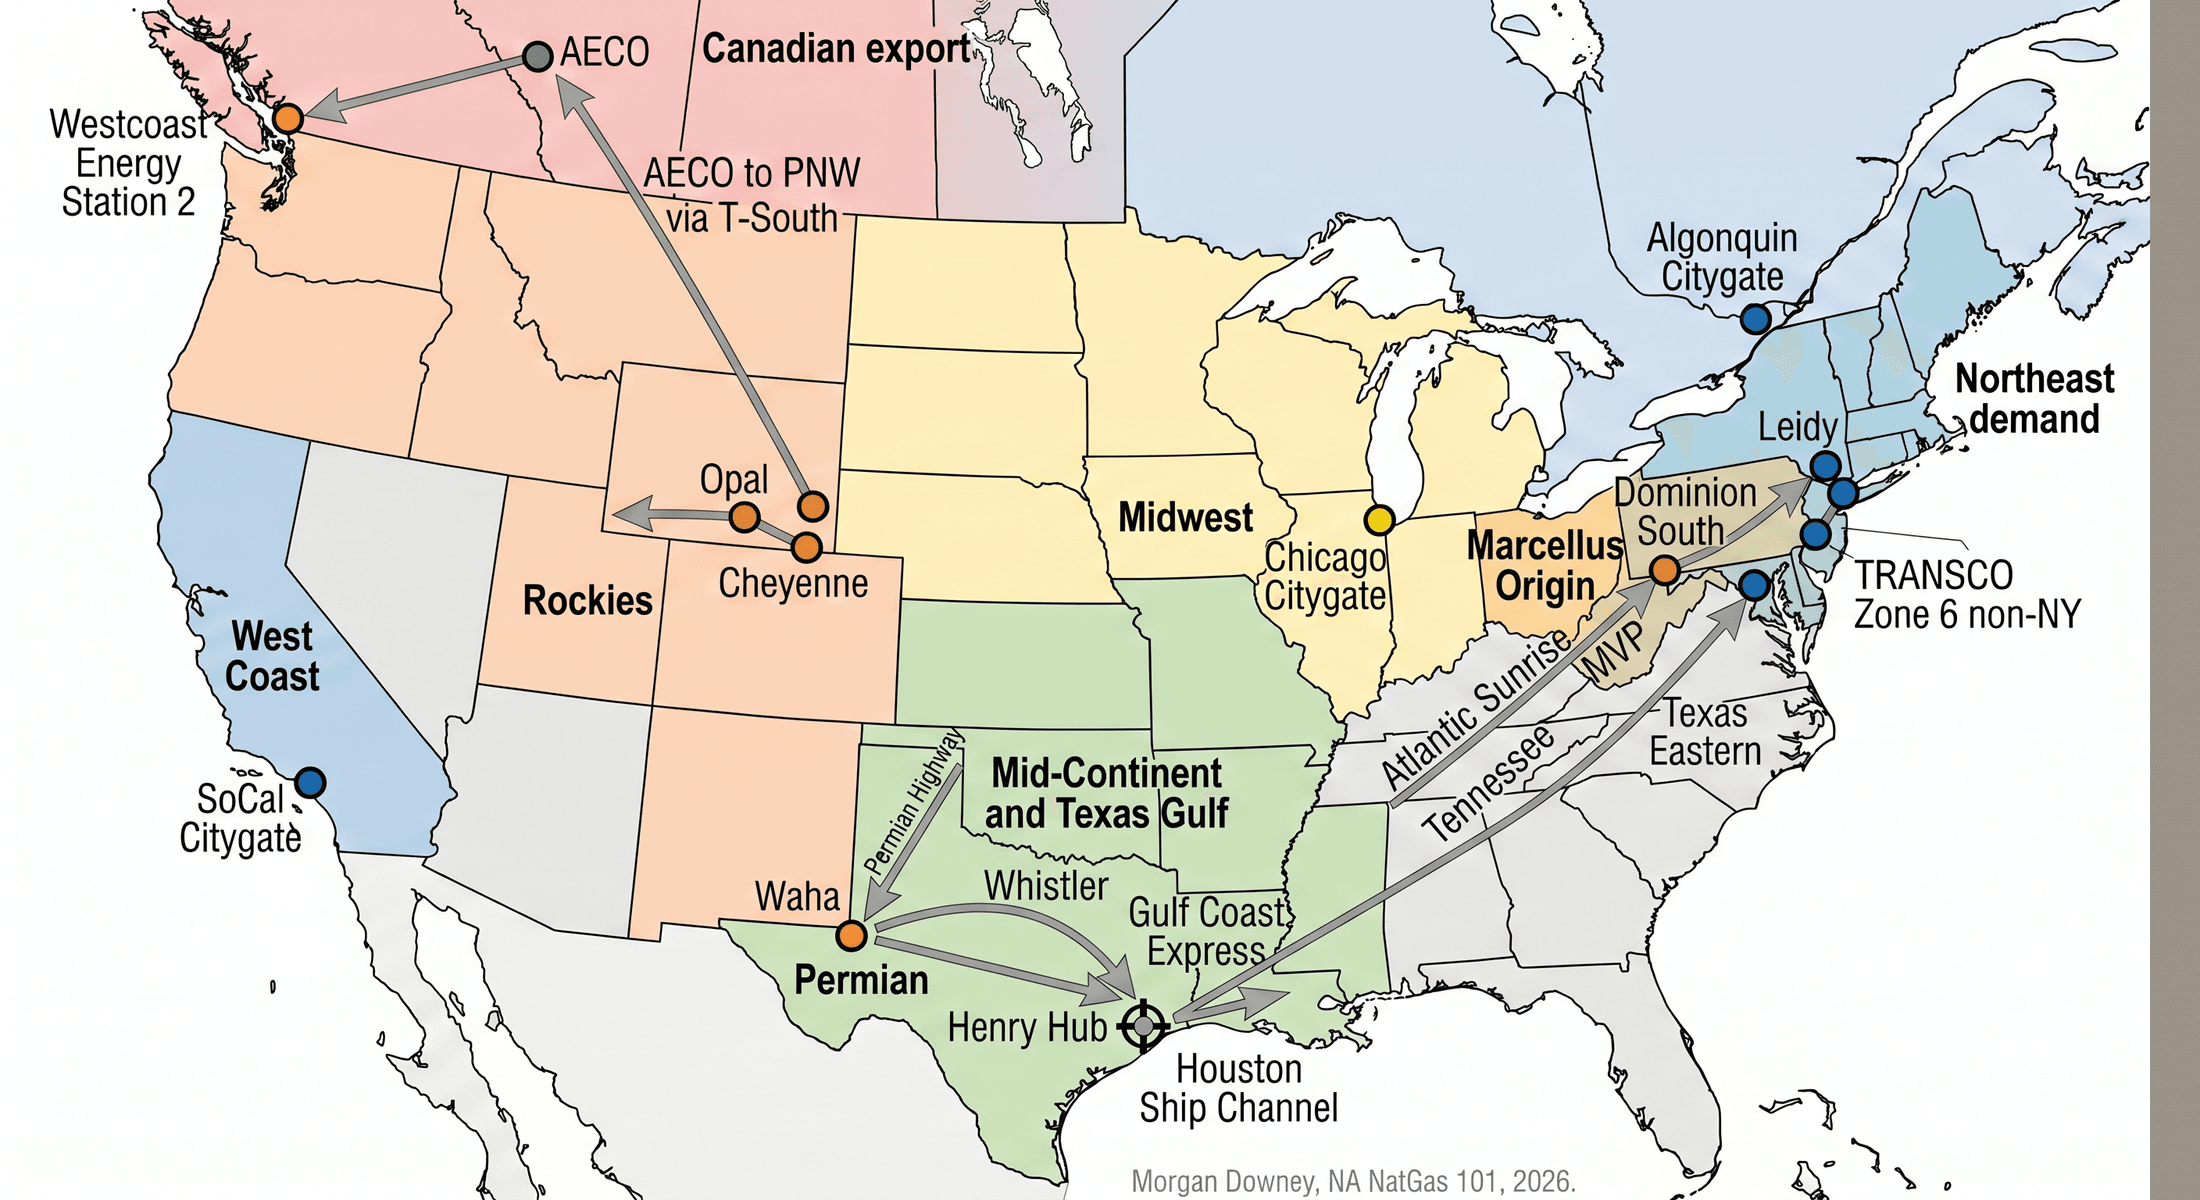
The constellation of US and Canadian pricing hubs runs to several dozen named delivery points. The major ones cluster by region.
Northeast demand. Algonquin Citygate is the eastern Massachusetts and Rhode Island delivery point on Algonquin Gas Transmission, the Spectra Energy line now owned by Enbridge that brings gas from Texas Eastern at the Hudson River into the Boston load center. Transco Zone 6 NY prices the gas delivered into New York City, New Jersey, and eastern Pennsylvania off the Williams Transcontinental system. Tennessee Zone 6 is the New England leg of Tennessee Gas Pipeline. Iroquois Zone 2 prices upstate New York and southern New England gas off the Iroquois Gas Transmission System. Each of these hubs prints a steep positive basis on cold January mornings when the regional pipelines are full.
Marcellus origin. Dominion South Point, often called Dominion South or Dom South, is the Eastern Gas Transmission delivery point that prices the dry-gas core of the Marcellus production. Tennessee Zone 4 Marcellus is the TGP delivery zone in southwestern Pennsylvania. Texas Eastern M2 is the TETCO Marcellus delivery zone. Leidy Hub, named for the Leidy gas storage field in Clinton County, Pennsylvania, is the Texas Eastern and Transco trunk delivery point on the Pennsylvania side of the production region. The Marcellus origin hubs trade at a structural discount to Henry Hub, the subject of a later section in this chapter.
Midwest. Chicago Citygate prices the Northern Illinois Gas (Nicor, now part of Southern Company Gas) and Peoples Gas city-gate delivery in metropolitan Chicago. MichCon Citygate prices the DTE Energy delivery into eastern Michigan. The ANR Pipeline hub, on the central and upper Midwest TC Energy line, is the marker for the Great Lakes basin gas trade. The Midwest hubs trade close to Henry Hub for most of the year, with positive basis spikes in the winter peak.
Mid-Continent and Texas Gulf. Houston Ship Channel is the major south Texas demand hub, a cluster of meters on the Texas intrastate grid serving the Gulf Coast petrochemical complex and the LNG export terminals at Sabine Pass and Freeport. Katy Hub is an inland Texas trading point on the same intrastate system. Carthage in east Texas serves the Haynesville producing region. Perryville in north Louisiana is the interconnect that ties Haynesville and Mid-Continent supply to the Gulf Coast trunk lines.
Permian. Waha is the central trading point in the West Texas Permian basin, defined as a basket of delivery points on the El Paso Natural Gas, Northern Natural, Oneok, and Atmos intrastate systems near the I-20 corridor. El Paso Permian is a separate El Paso Natural Gas system point that prices the EPNG capacity out of the basin. The Permian hubs are the canonical example of supply-side basis weakness, also covered later in this chapter.
Rockies. Opal is a southwestern Wyoming hub on Williams Northwest Pipeline, sitting at the meeting point of Wyoming and southwestern production with the Pacific Northwest takeaway. CIG, the Colorado Interstate Gas system delivery point, is the Front Range marker. Cheyenne is the Cheyenne Connector hub in eastern Wyoming, completed by Tallgrass Energy in 2019 to connect DJ Basin production to the REX Pipeline.
West Coast. Sumas is the Cascades crossing where Western Canadian gas enters Williams Northwest Pipeline, the fragile chokepoint that printed $200 per MMBtu in late November 2018. SoCal Citygate prices the Southern California Gas Company city-gate delivery into the Los Angeles basin. PG&E Citygate prices the PG&E system delivery into Northern California. Malin is the Oregon-California intertie on the former Pacific Gas Transmission line south from Canada, now operated as Gas Transmission Northwest within the TC Energy portfolio.
Canadian export hubs. AECO is the Alberta hub, named for the original Alberta Energy Company that consolidated the central Alberta storage and trading network in the 1990s. AECO is the Henry Hub of Western Canada and prices the Western Canadian Sedimentary Basin gas that flows south on TC Energy’s NGTL system into the US Pacific Northwest, Mid-Continent, and Midwest. Dawn Hub is the Ontario storage and trading hub at the Union Gas (now Enbridge) Dawn salt cavern complex in Lambton County, the largest storage hub in Canada and the eastern entry point for Marcellus gas into the Canadian system. Empress is the hub at the Alberta-Saskatchewan border on the TC Energy Mainline.
The geographic structure of the hub network mirrors the pipeline grid covered in Chapter 10. Hubs cluster at pipeline interconnects, at storage facilities, and at the transitions between supply regions and demand regions. Basis at each hub captures the locational scarcity, or surplus, of pipeline capacity through that point on a given day. The price screen of forty US and Canadian basis points read across at any moment is a snapshot of which pipelines are full and which are not.
Calendar Spreads, Contango, and the Seasonal Curve
The Henry Hub forward curve has a characteristic seasonal shape. Winter delivery months trade at a premium to summer delivery months because storage operators bid up winter prices to recover the full cost stack of injection, demand charges, transport, and capital return. The shape of the curve is the visible signature of the seasonal storage trade developed in Chapter 11.
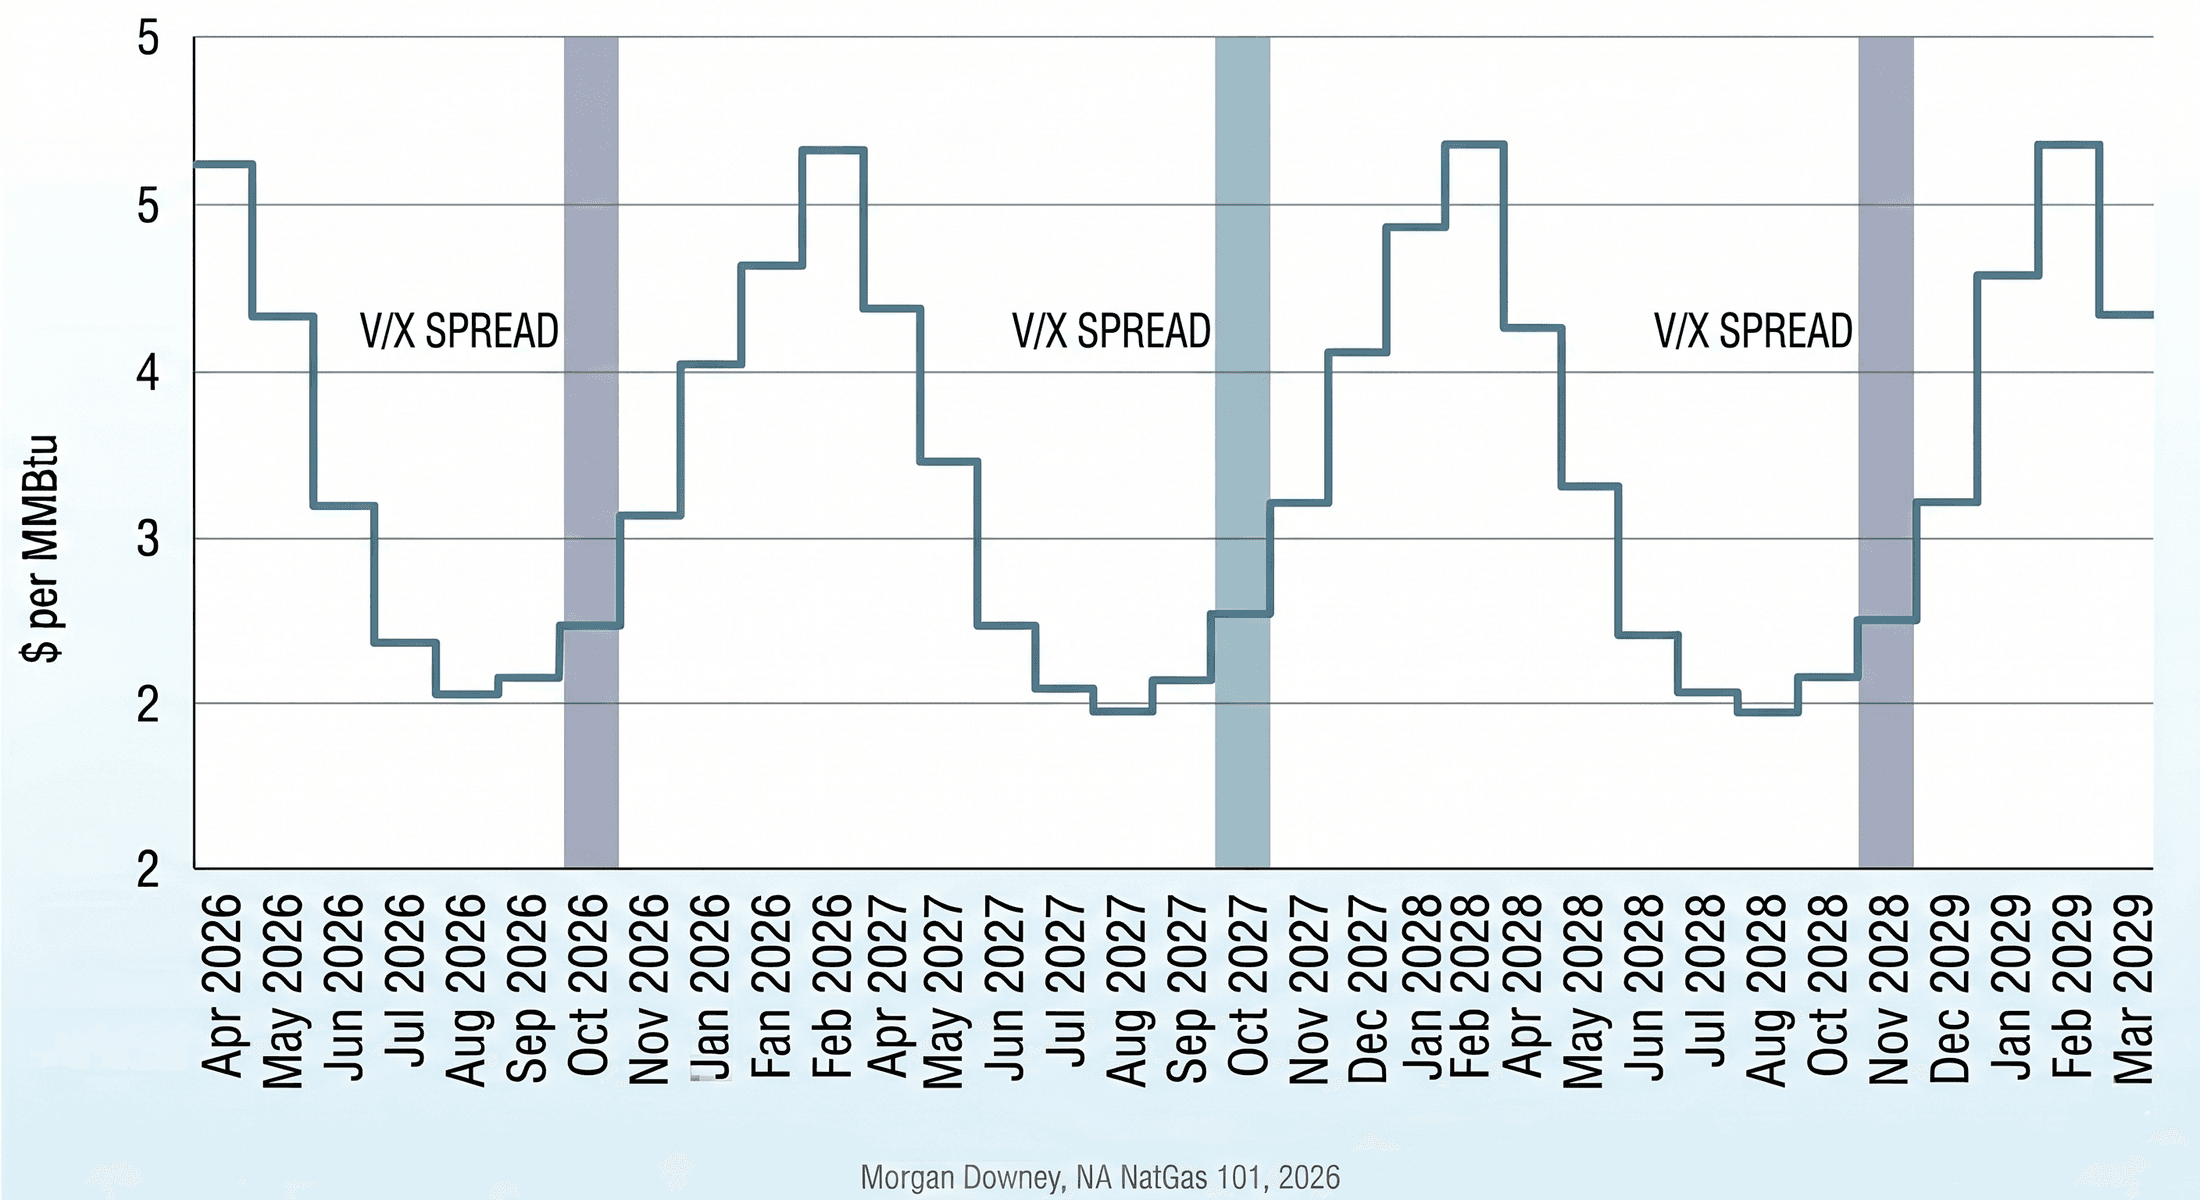
The November-October calendar spread is the price of storage carry at the most physically meaningful inflection point. October is the last injection month; November is the first withdrawal month. On NYMEX month codes, October is V and November is X, so the spread is denoted V/X (or X minus V). A wide V/X spread covers the storage industry’s full cost stack: the demand charges for firm storage capacity, the volumetric injection and withdrawal charges, the transport from production hub to storage field and from storage field to delivery hub, the fuel and shrinkage on those transport legs, and the operator’s return on invested capital. A narrow V/X spread does not.
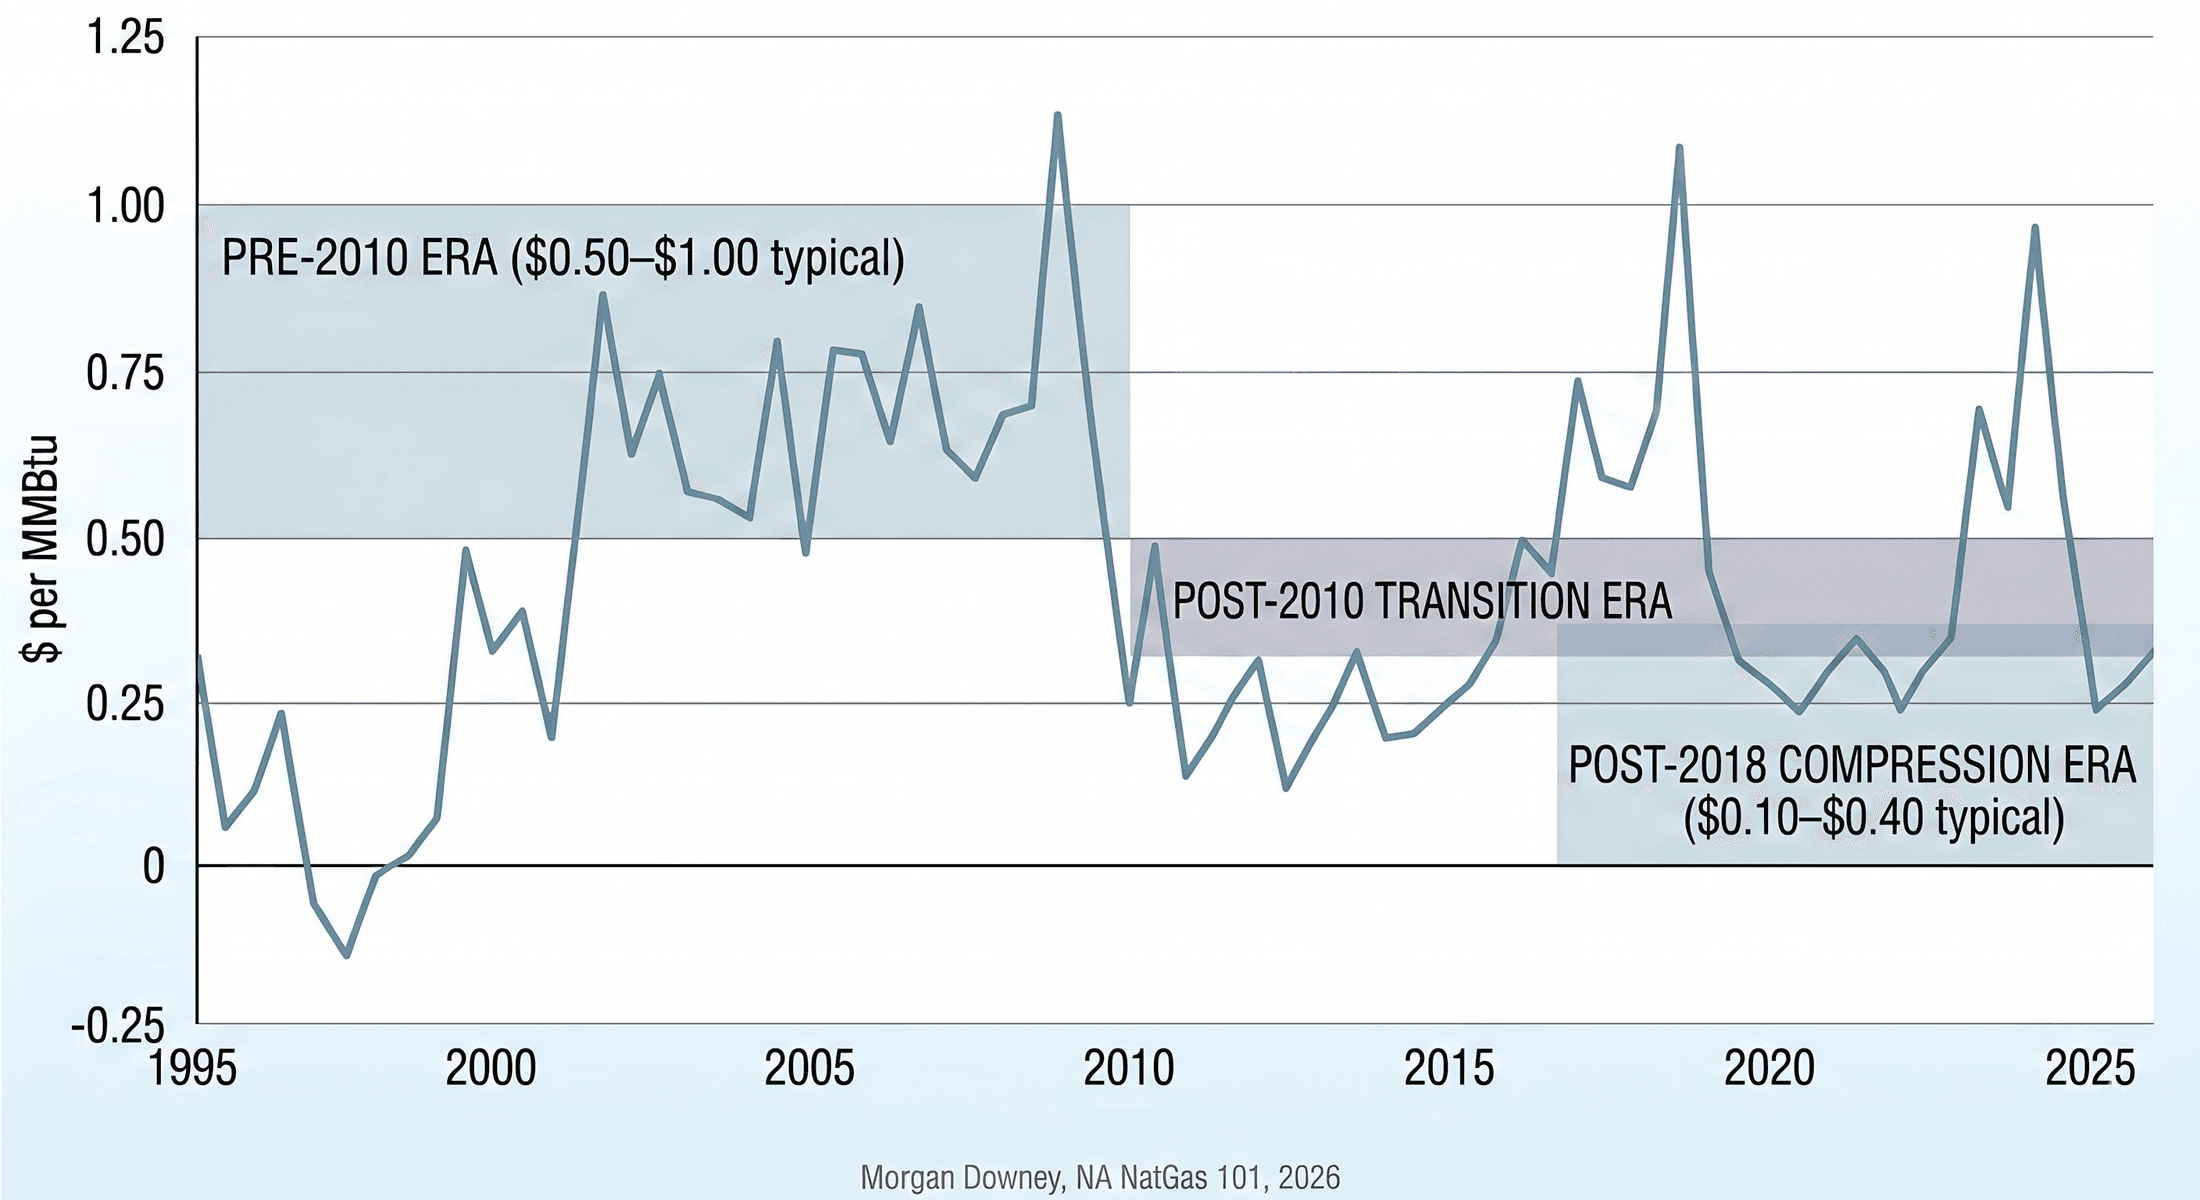
The Marcellus production growth from 2010 through 2024 compressed the V/X spread structurally. Through the 1990s and 2000s, the November-October spread averaged roughly $0.50 to $1.00 per MMBtu, sometimes wider in tight years. After the post-2010 production surge filled summer storage to near-capacity and pushed back-end-of-summer Henry Hub prices below $3 per MMBtu, the V/X spread narrowed to a range of roughly $0.10 to $0.40 per MMBtu through much of the post-2018 period. The compression was a direct financial pressure on the storage industry. Operators that had sized firm capacity contracts and demand charges against the wider 2000s spread saw their economics tighten when the spread fell. Storage tariff cases in front of FERC in the post-2018 period have repeatedly cited the compressed seasonal spread as evidence that the cost of service is no longer being recovered through the market.
The H/J spread (March minus April) captures the late-winter inversion. March is the last winter delivery month; April is the first injection month. The spread expresses the value of having gas in storage at the end of winter versus the cost of refilling in early spring. In a tight winter, March can trade $1.00 to $3.00 per MMBtu above April; in an ample winter, the spread can collapse to a few cents. The H/J spread is the cleanest market read on whether the country has enough gas to finish the heating season.
Contango, the term-structure shape with the front contract trading below the back, is the normal shape of the curve during the summer shoulder season. The forward curve typically slopes upward from June through January, dips slightly through late winter, and resumes the seasonal climb the following autumn. Backwardation, the inverse shape, appears in winter peak conditions when scarcity is in the immediate term and storage and forward production are expected to cover the future. The 2014 polar vortex, the 2018 January cold snap, and the 2021 Winter Storm Uri each printed sharp backwardation in the front of the curve.
The structural feature of the gas curve is that the seasonal shape carries information that is absent from the oil curve. The shape of the strip prices the storage industry’s inventory cycle. A trader who reads the V/X spread, the H/J spread, and the calendar-year strips against expected weather and storage trajectory has read most of the macro signal in the gas market. Front-month outright prices catch the headlines. Spreads carry the meaning.
The Futures Contract and the OTC Basis Swap Market
NYMEX NG is the headline futures contract. The contract trades on CME Globex with electronic access roughly 23 hours a day, opening Sunday evening at 6:00 PM Eastern and closing Friday afternoon at 5:00 PM Eastern, with a daily one-hour maintenance pause. Settlement is financial cash settlement against the contract month’s final settlement price for nearly all volume; the small share of contracts that go to physical delivery exercise that option through the CME clearinghouse against the Sabine Pipe Line schedule at Henry Hub. Open interest exceeds 1.5 million contracts across the listed strip on a typical day, concentrated in the prompt year.
ICE, the Intercontinental Exchange, lists the basis swap futures market for each major US hub and a substantial roster of Canadian hubs. An ICE basis swap is structured as the difference between the hub’s monthly index price (the Inside FERC first-of-month index for that hub) and the Henry Hub final settlement for the same contract month. The buyer of a basis swap pays a fixed differential and receives the floating Inside FERC index minus the Henry Hub final. A positive basis swap price means the buyer expects the hub to trade above Henry Hub; a negative price means below. Basis swaps quote in absolute dollars per MMBtu, not as a percentage.
The OTC basis swap market, transacted bilaterally between dealers and end-users and cleared through ICE Clear Europe or ICE Clear US, is where most of the actual basis volume happens. The exchange-listed basis futures are the standardized version of the OTC market and serve as the price discovery layer for the bilateral trade. ICE basis swaps trade roughly 50 to 100 contracts per Henry Hub futures contract on a typical session. The visible price screen of basis swap differentials is comparable in informational density to the underlying NYMEX outright curve.
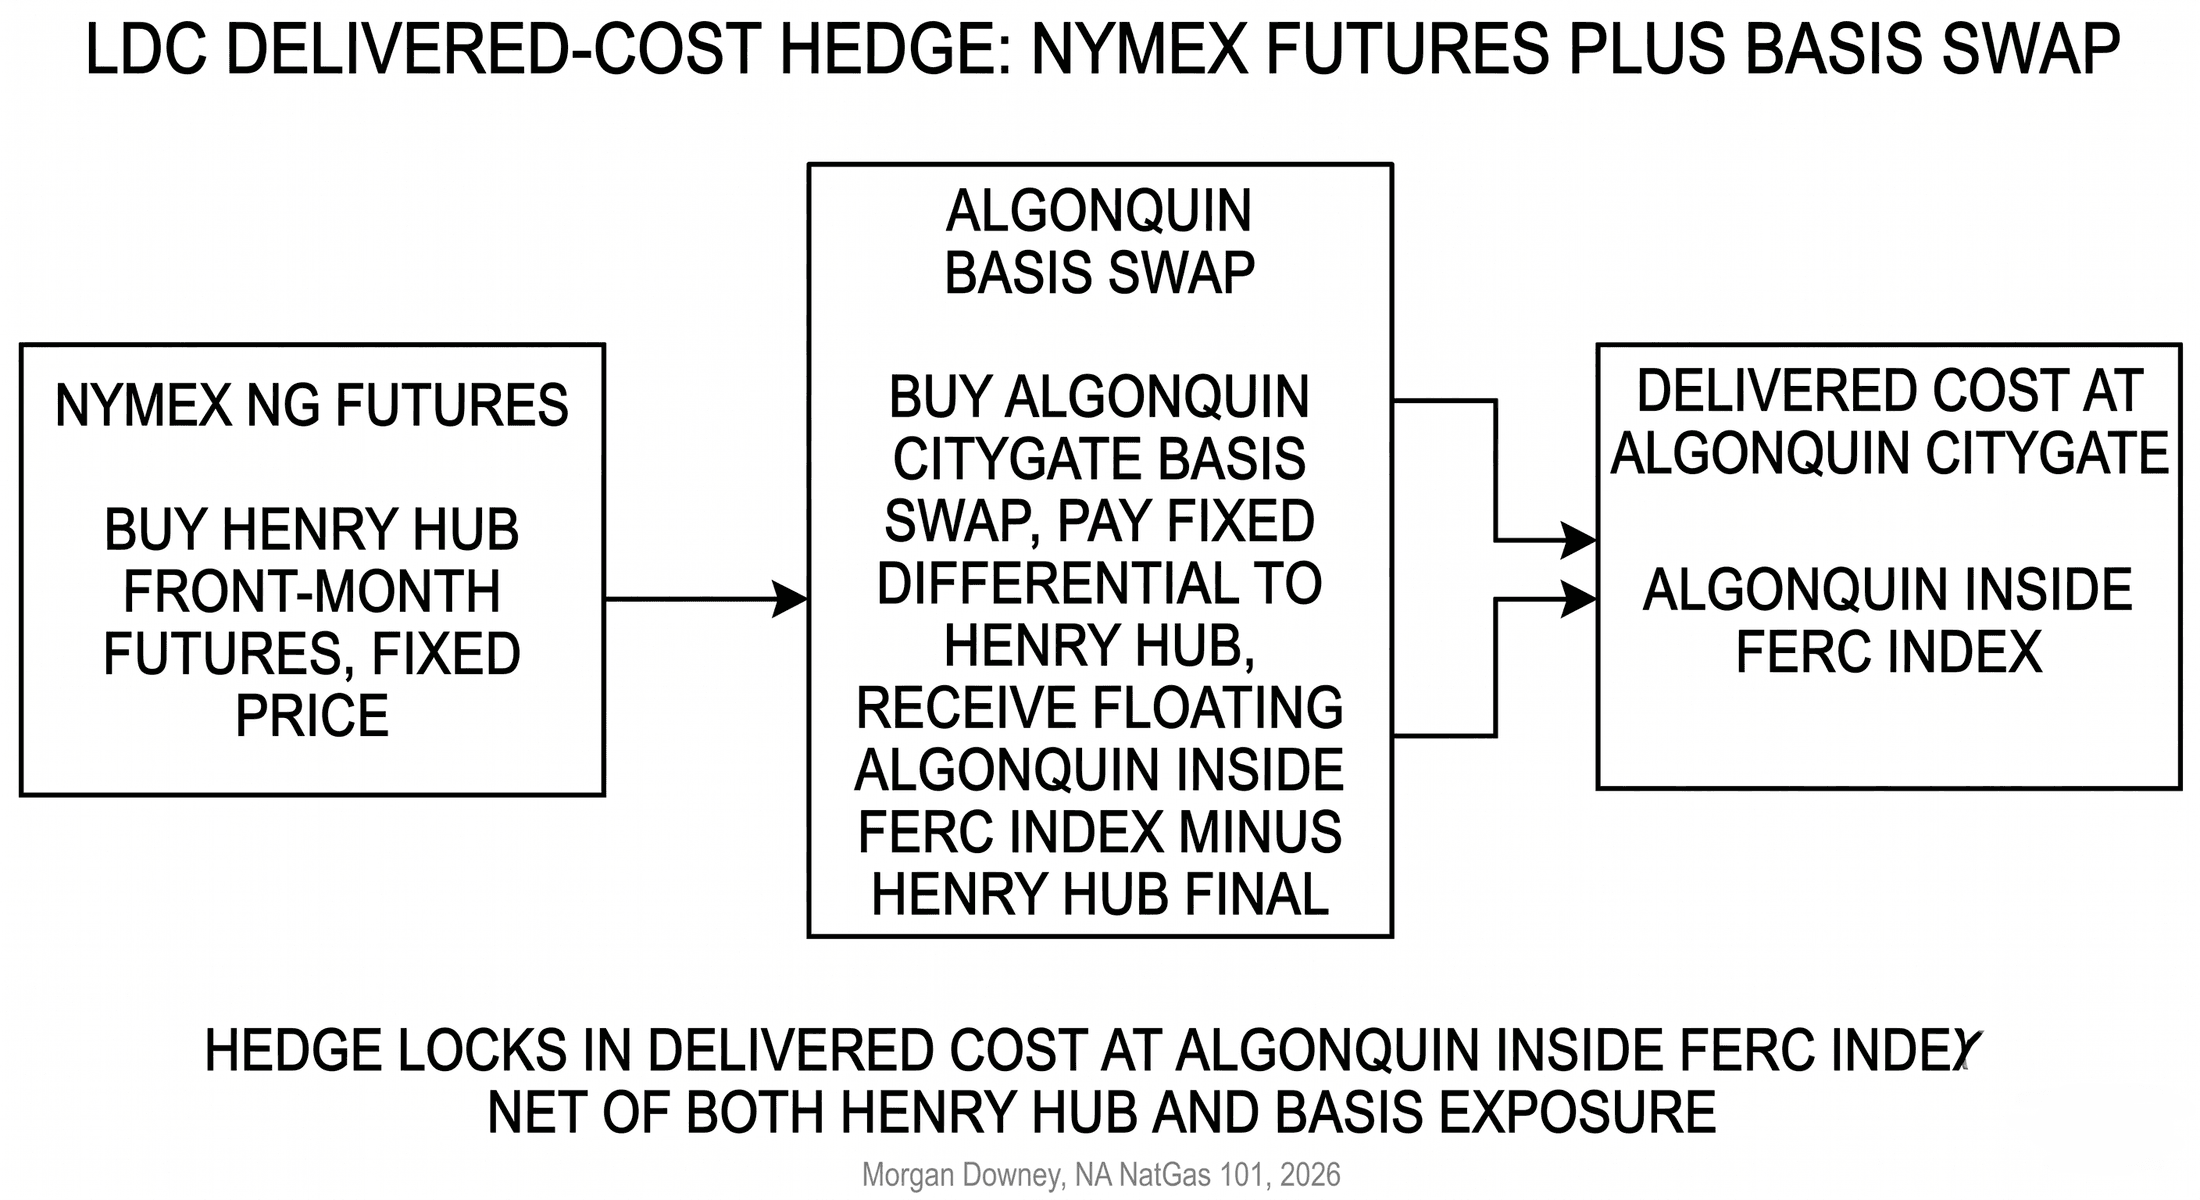
Producers, marketers, utilities, and LNG developers use basis swap pricing for the prompt month, the calendar strip, and the longer-dated five-year strip to value transport capacity, hedge production exposure, and structure long-term sale and purchase agreements. A Marcellus producer with firm transport on Texas Eastern from M2 to Zone 6 NY values that transport contract by reference to the M2 minus Zone 6 NY basis swap differential. An LNG offtaker with a Henry Hub-linked SPA at Sabine Pass values the marginal feedgas cost by reference to the Henry Hub minus Houston Ship Channel basis. A New England LDC procurement desk hedges its city-gate exposure by buying NYMEX NG futures plus an Algonquin Citygate basis swap. The two legs together are the actual delivered hedge; either leg by itself leaves the firm exposed to the residual.
The calendar strip pricing for basis is the layer at which long-term commercial decisions are made. A producer evaluating a five-year firm transport contract on Mountain Valley Pipeline reads the five-year forward strip of MVP-corridor basis swaps to value the optionality the contract grants. An LDC negotiating a ten-year city-gate sale agreement with a marketer reads the corresponding ten-year basis strip to size the structural premium the customer is paying. The longer-dated end of the basis strip thins out in liquidity beyond three years and trades on indicative quotations from a handful of dealers rather than on a continuous screen, but the marks set the reference for the long-term commercial layer.
The basis swap market is what turns Henry Hub from a single benchmark into a usable price layer for the rest of the continent.
Settlement Conventions: LD, Pen Day, and Why Gas Is Different
OTC gas swaps almost universally settle “Last Day,” abbreviated LD, on the same day as the corresponding NYMEX NG futures contract expiry. The third-business-day-before-the-first-of-month last trading day is the LD reference for that contract month, and the swap settles against the official NYMEX NG final settlement price published by CME for that day. OTC gas options settle one business day earlier, the so-called “pen day” for penultimate. Pen day exists so that an option holder can declare exercise the day before the underlying swap goes to settlement, allowing the resulting swap position to settle cleanly against the LD print on the next session. The LD and pen day conventions are the standard across the dealer-marketer network and across the producer-and-utility hedging book.
The settlement style is “European” or “bullet” in market parlance, the price for the entire delivery month is set on a single trading day. This is structurally unusual. Most other commodity markets settle on a monthly average, the so-called “Asian” or arithmetic-mean style, in which the contract’s settlement is the mean of daily prices across the delivery month. WTI crude oil swaps, ICE Brent CFDs, the OPIS Mont Belvieu NGL strip, and most refined-products swaps all settle as monthly averages of the underlying daily prints. The asymmetry is striking given that natural gas is the most ratably-delivered of any of those commodities. A pipeline delivers gas at a constant flow rate every hour of every day across the month; a tanker of crude lifts at a single point in time. The intuition would predict gas to be the average and oil to be the bullet. The market settled the other way.
The historical reason is the storage architecture. Natural gas storage is metered at the daily-flow level but cleared commercially at the monthly-baseload level, with bidweek setting the first-of-month index for the entire calendar month. The bidweek cycle anchors physical commerce in a single monthly price for the full delivery period. The futures market, designed in 1990 to hedge that bidweek cycle, mirrored the convention: one settlement, one delivery month, one price. Crude oil and NGLs, which trade with much higher intramonth daily volatility around long-distance shipping arrangements, evolved monthly-average settlement to smooth the noise. Gas, which already had an institutional monthly-baseload price discovery mechanism in bidweek, did not need it. The legacy choice carries forward: gas is the bullet, oil and NGLs are the average, despite the underlying physical delivery profile pointing the opposite way.
Bidweek, Monthly Indexes, and Inside FERC
Physical natural gas is delivered under three temporal contract structures. Each carries its own price reference.
Monthly baseload contracts price gas for delivery at a constant flow rate over the entire calendar month. The reference is the Inside FERC Gas Market Report monthly index, published by S&P Global Commodity Insights (the publisher that absorbed the Platts business through the IHS Markit merger that closed in 2022) on the last business day of each month based on a survey of physical-gas traders for first-of-month delivery at each covered hub. The five business days leading up to the Inside FERC publication, called bidweek, are the period during which the physical-trade volume that sets the index is transacted. Bidweek is the most liquid period in the physical gas market. Utility procurement desks, producer marketing teams, marketer flow desks, and industrial buyers transact most of their monthly physical volume during the five-day window.
The Inside FERC index is the contractual reference for monthly baseload sale agreements across the US gas industry. A utility’s gas-supply contract with a marketer at Chicago Citygate typically prices at “Inside FERC Chicago Citygate first-of-month, plus or minus a fixed differential.” A producer’s wellhead sale to an aggregator typically prices at “Inside FERC at the relevant origin hub, less a gathering and transport deduction.” The index is the gravity well around which monthly physical commerce orbits.
Daily contracts price gas for next-day flow at each covered hub. The reference is Platts Gas Daily, also published by S&P Global Commodity Insights, which calculates a daily volume-weighted average of physical bids and offers for next-day delivery at each covered hub. Daily contracts cover the volume that bidweek baseload contracts cannot: weather-driven swing demand, intraday balancing, and operational gas movement on the pipeline grid. The Sumas $200 print of November 2018, the Algonquin $80 print of January 2018, and the Waha sub-zero prints of the post-2019 period are all Platts Gas Daily prints, not Inside FERC prints.
Intraday and same-day trading is bilateral and quoted off the ICE intraday market and the dealer-broker network. The volume is small relative to bidweek and daily, but the prints set the marginal price that pipeline operators use to balance their systems on a given hour.
The three indexes are the bridge between paper and physical. Without them, the futures curve has no anchor.
How Basis Swaps Settle: Two Conventions
Around 75 percent of US natural gas basis volume settles against the First of Month (FOM) bidweek index, published as Inside FERC (IF), Natural Gas Intelligence (NGI), or Platts Bidweek. FOM is the standard for financial basis swaps and longer-term producer and utility hedges. The remaining 25 percent settles against the Platts Gas Daily monthly average, used mostly for shorter-term deals and physical transactions where daily flow is the relevant exposure. A trader who knows the flat-price NYMEX NG settlement convention but not the basis convention will mis-mark a position by an entire month. The split is worth committing to memory.
| Aspect | Convention A: Gas Daily / Index | Convention B: FOM / Bidweek |
|---|---|---|
| Market share of US basis volume | Around 25% | Around 75%; default for ICE basis |
| Where it is used | Shorter-term deals; physical transactions where daily flow is the exposure | Financial basis swaps; longer-term producer and utility hedges |
| Settlement formula | Monthly arithmetic average of daily basis prices during the production month | Single basis price published on the first business day of the FOLLOWING month |
| Index publisher | Platts Gas Daily (S&P Global) | Inside FERC (IF), Natural Gas Intelligence (NGI), Platts Bidweek |
| Worked example: April 2026 delivery | Settle = arithmetic mean of daily basis prints across April 2026 | Settle = the April-2026-delivery basis price posted on Friday May 1, 2026 |
| Typical underlying instrument names | Henry Hub Gas Daily, Henry Hub Index | TCO Basis, Dom South Basis, TETCO M2 Basis, REX Zone 3 Basis |
The April 2026 example is concrete. A trader holding a TCO Basis swap for April 2026 delivery, marked under Convention B, settles on the basis print published this morning, May 1. The same trader holding a Henry Hub Gas Daily swap for April 2026 delivery, marked under Convention A, settles on the average of all April daily prints. The two paths can diverge by tens of cents per million British thermal units in a volatile month, and an unhedged settlement-convention assumption shows up as a one-off mark-to-market move on the swap when the physical settlement actually clears.
Marcellus Negative Basis and Producer Pain
The structural shift in US gas geography after 2010 produced a basis architecture in which the major production hubs trade at a meaningful discount to Henry Hub. Dominion South Point, Tennessee Zone 4 Marcellus, and Texas Eastern M2 routinely traded at $0.50 to $1.50 per MMBtu below Henry Hub through the 2014 to 2020 period as Marcellus production growth outran the takeaway pipeline capacity into the demand-side hubs east, south, and west of Pennsylvania. Producers received the local hub price (Henry Hub minus the negative basis) net of gathering, processing, and transportation costs.
The capital structure of the Marcellus producer fleet through the 2014 to 2018 period was built on the assumption that the negative basis would compress as new takeaway pipelines came online. Atlantic Sunrise, the Williams Transcontinental project that added 1.7 Bcf/d of southbound capacity from northeastern Pennsylvania to the Mid-Atlantic and Southeast, came in service in October 2018. The REX Pipeline reversal projects through 2014 and 2015 added eastbound capacity from the Marcellus to the Midwest. Mountain Valley Pipeline, a 303-mile, 2.0 Bcf/d, 42-inch line from West Virginia to Virginia, was originally targeted for in-service in 2018 at a budget of $3.5 billion. After six years of permitting litigation, route challenges, and the federal statutory override embedded in the Fiscal Responsibility Act of 2023, MVP entered commercial service in June 2024 at a final cost of $7.85 billion. The slow pace of the post-2014 takeaway buildout extended the negative-basis era well beyond producer expectations.
The financial pressure on Appalachian producers through the period was acute. EQT, the largest Marcellus producer by gross production, executed multiple debt restructurings between 2018 and 2020. Range Resources reduced its drilling program in three consecutive years. Cabot Oil and Gas merged with Cimarex Energy in 2021 to form Coterra Energy, in part to diversify away from pure-Marcellus basis exposure. Antero Resources executed firm-transport contracts on every available pipeline out of the basin, locking in delivered volumes at demand-hub prices but bearing the firm-transport demand charge whether or not the gas flowed.
The Permian negative basis at Waha tells the same story under different drivers. Permian gas is a byproduct of crude oil drilling. The producer’s primary economic decision is the oil program, not the gas value. Pipeline takeaway capacity has historically lagged the production growth in associated gas, and the gas price at Waha has been the residual price. Waha first traded negative on Wed Apr 3, 2019, as Permian associated gas growth outran takeaway pipelines including Gulf Coast Express, Permian Highway, and Whistler. Negative-pricing episodes have recurred in 2020, 2022, 2023, and 2024 with single-day prints below negative $5 per MMBtu. The financial logic of negative pricing is that producers will pay the pipeline to take the gas rather than flare it or curtail oil production.
The Mountain Valley Pipeline in-service in June 2024 began the structural compression of the southern Marcellus negative basis. The Matterhorn Express in-service in 2024 began the same compression at Waha. The negative-basis era has not ended. It has begun to narrow.
The European Reference: TTF and JKM
The TTF (Title Transfer Facility) front-month contract on ICE Endex, the JKM (Japan-Korea-Marker) assessment from S&P Global Commodity Insights, and the Henry Hub front-month on NYMEX are now linked through the LNG export trade developed in Chapter 14. The triangulation prices the marginal LNG cargo route from a Gulf Coast US terminal to a European or Asian regasification facility.
The arbitrage relationship for a European-bound cargo: TTF minus Henry Hub minus the Gulf-to-Europe shipping cost minus the Henry Hub-to-jetty feedgas cost minus the regasification fee approximately equals the cargo margin available to a Henry-Hub-linked SPA seller. The Gulf-to-Europe shipping cost on a typical 174,000 cubic meter membrane tanker runs roughly $0.70 to $1.20 per MMBtu, depending on charter rate and route. The 115 percent of Henry Hub plus a fixed liquefaction fee on US sale and purchase agreements, covered in Chapter 14, sets the FOB cost at the jetty.
The arbitrage relationship for an Asian-bound cargo: JKM minus Henry Hub minus the Gulf-to-Asia shipping cost minus the Henry Hub-to-jetty feedgas cost minus the regasification fee approximately equals the cargo margin to Asia. The Gulf-to-Asia shipping cost runs roughly $1.50 to $2.50 per MMBtu, reflecting the Panama Canal route or the longer Cape of Good Hope route when Panama transit slots are constrained.
The TTF-JKM spread is the price of moving an LNG cargo between the European and Asian basins. It reflects the marginal shipping cost between the two markets and the inventory differential at any given moment. Every LNG marketer in the world watches the spread minute-by-minute. The spread tells the spot fleet which way to sail.
The structural feature is that Henry Hub is now the global anchor for LNG pricing in a way it was not before 2016. Through the period of the 1970s through the 2000s, global LNG pricing was dominated by oil-indexed long-term contracts written against Brent and JCC (the Japan Crude Cocktail), with TTF and NBP serving as European reference points and JKM only emerging as a spot benchmark after 2009. The Henry Hub linkage entered the global market through the post-2014 wave of US LNG export project FIDs and reached structural significance after the Russian invasion of Ukraine in 2022. Henry Hub does not yet price the majority of internationally traded LNG by volume, but it sets the marginal cost reference for the spot cargoes that clear the global market on a given week.
The basis between TTF, JKM, and Henry Hub is the global version of the basis-point archipelago this chapter has been describing. The mechanics are the same. The geography is wider.
The First NYMEX NG Contract, April 1990
On Tue Apr 3, 1990, at the opening bell on the NYMEX trading floor at 4 World Trade Center, the natural gas futures pit traded for the first time. The contract listed for delivery at Henry Hub. First-day volume was reported at 1,177 contracts. The contract specification was the product of three years of design work led by NYMEX research staff in consultation with a working group of producers, marketers, and utility procurement officers who had repeatedly told the exchange that the existing patchwork of bilateral utility-procurement contracts produced no transparent forward price.
The 1990 launch sat in the immediate aftermath of FERC Order 436 (1985) and FERC Order 500 (1987), which had begun the unbundling of pipeline transport from merchant gas sales and opened pipeline capacity to non-pipeline shippers. Without the unbundling, there was no liquid spot market for gas, and a futures contract would have had no underlying physical price to settle against. Order 636, issued in 1992, completed the structural separation that the futures contract needed to mature.
By the end of 1990, NYMEX NG was averaging roughly 1,500 contracts per day. By 1995 the figure was 30,000. By 2005 it was 70,000. By 2024 it was over 400,000. The slow infrastructure-driven move from a balkanized utility-procurement model to a standardized financial benchmark took less than a generation. Henry Hub became “the gas price” because the contract was there to make it so.
The basis market is the visible price signal of pipeline scarcity. Chapter 16 turns to the contractual layer beneath that signal: the firm and interruptible transport service classes, the capacity release market, and the FERC tariff structure that determines who has the right to move the molecule when capacity is full.