LNG Export
Liquefaction technology, mega-trains, the cryogenic fleet, regasification, and the shift from a landlocked North American market to a global commodity linked through ocean-going cargoes.
On Wed Feb 24, 2016, the LNG tanker Asia Vision finished loading at Cheniere Energy’s Sabine Pass terminal in Cameron Parish, Louisiana, cleared the jetty, transited the ship channel into the Gulf of Mexico, and headed for the Petrobras regasification terminal at Pecem in northeast Brazil. The cargo was the first commercial LNG export from the Lower 48 states in modern history. The legacy Kenai LNG plant on the Cook Inlet in Alaska had exported to Japan continuously from 1969 to 2015, but Kenai was a small plant on a stranded basin and was never connected to the Lower 48 grid; for the entire forty-year stretch through 2015, the contiguous United States was a gas importer, not an exporter.
Sabine Pass had been built in 2008 as an import terminal. The original FERC authorization issued to Cheniere in 2004 was for a regasification facility designed to land Trinidadian, Qatari, and West African LNG at the southwest Louisiana coast and inject it into the high-volume interstate grid feeding the Gulf Coast petrochemical complex. The shale revolution of Chapters 4 and 5 inverted that thesis between groundbreaking and commissioning. By 2010, Henry Hub had decoupled from Brent crude and Cheniere had filed for FERC authorization to add liquefaction trains and reverse the flow of the terminal. The Asia Vision cargo was the first product of that reversal.
Cheniere’s customers had paid the project nameplate tolling fee through the construction period regardless of whether the trains were running, on long-term sale-and-purchase agreements indexed to 115 percent of Henry Hub plus a fixed liquefaction charge. The chapter that follows is the architecture of the LNG export complex that Cheniere’s first cargo opened: the cryogenic chemistry that turns 600 cubic feet of pipeline gas into one cubic foot of liquid, the eight operating US terminals that consume 14 Bcf/d of feedgas, the global tanker fleet that ships the molecule, and the contract templates and permitting architecture that finance and authorize the trade.
Liquefaction: Cooling Gas to Minus 162 Celsius
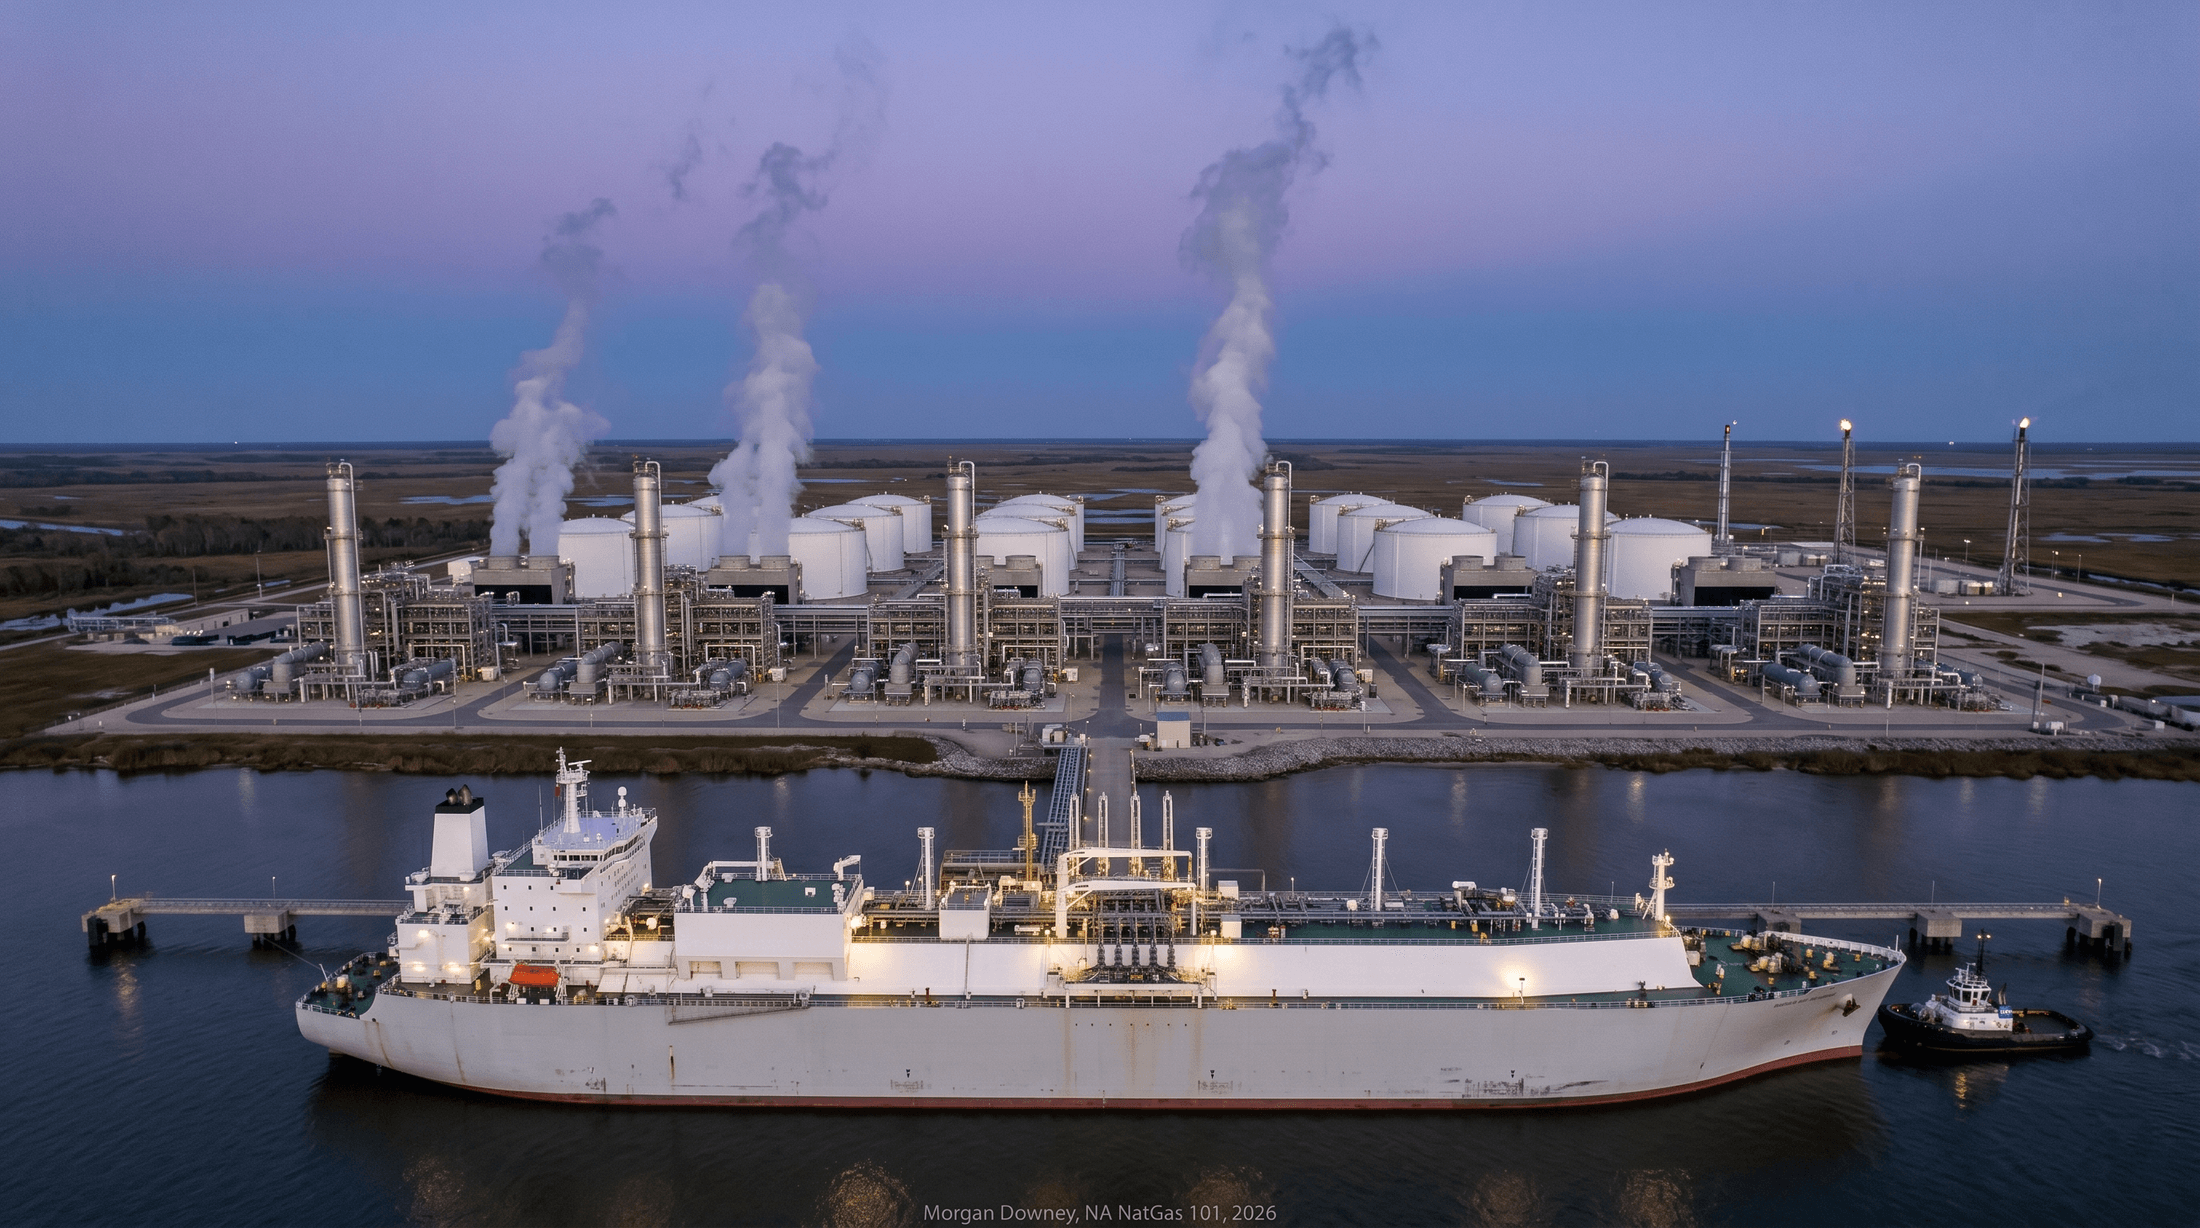
Methane liquefies at minus 162 degrees Celsius, equivalent to minus 259 degrees Fahrenheit, at atmospheric pressure. The volume reduction from gas at standard conditions to liquid is roughly 600 to 1, which is the entire commercial point: a 174,000 cubic meter membrane tanker carries the energy equivalent of roughly 3.5 Bcf of pipeline gas, an inventory that no marine pipeline could match across an ocean basin. The thermodynamic challenge is removing the heat to reach that temperature against a hot, humid Gulf Coast ambient. The chosen industrial pathway is a refrigeration cascade.
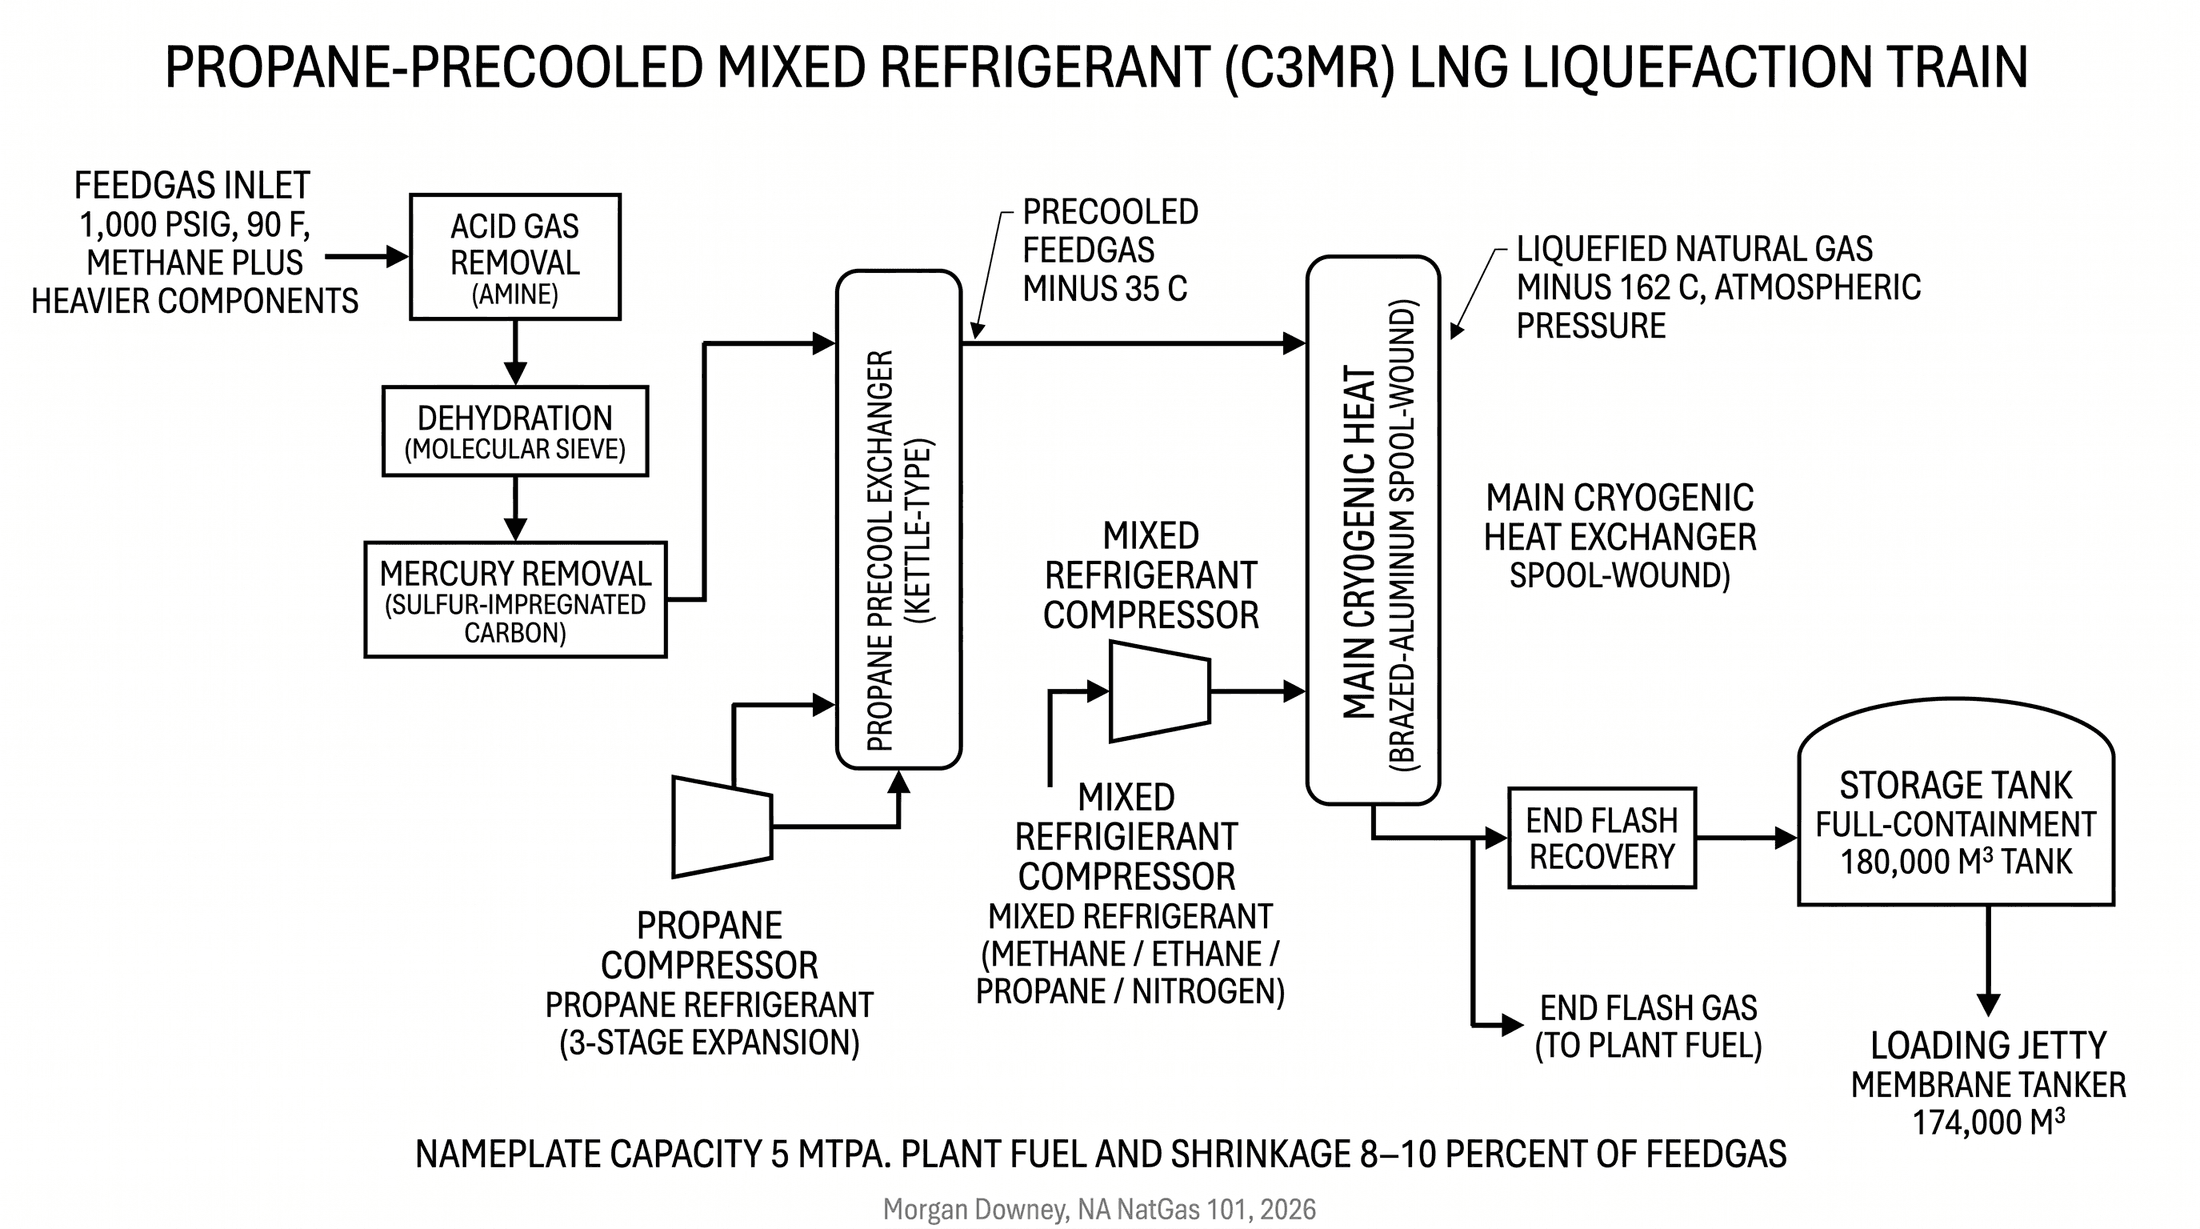
The end-to-end sequence of pretreatment, refrigeration, and storage equipment is called a liquefaction train, named for the linear flow of gas through the unit operations from inlet at one end to LNG storage tank at the other, in the same way that a chemical or refining process line is called a train. A modern Gulf Coast LNG plant typically operates two to six parallel mega-trains, each rated 4 to 6 million tonnes per annum (MTPA), or 18 to 36 mid-scale modular trains rated 0.6 to 1.2 MTPA each. Sabine Pass operates six mega-trains; Plaquemines is permitted for 36 modular trains.
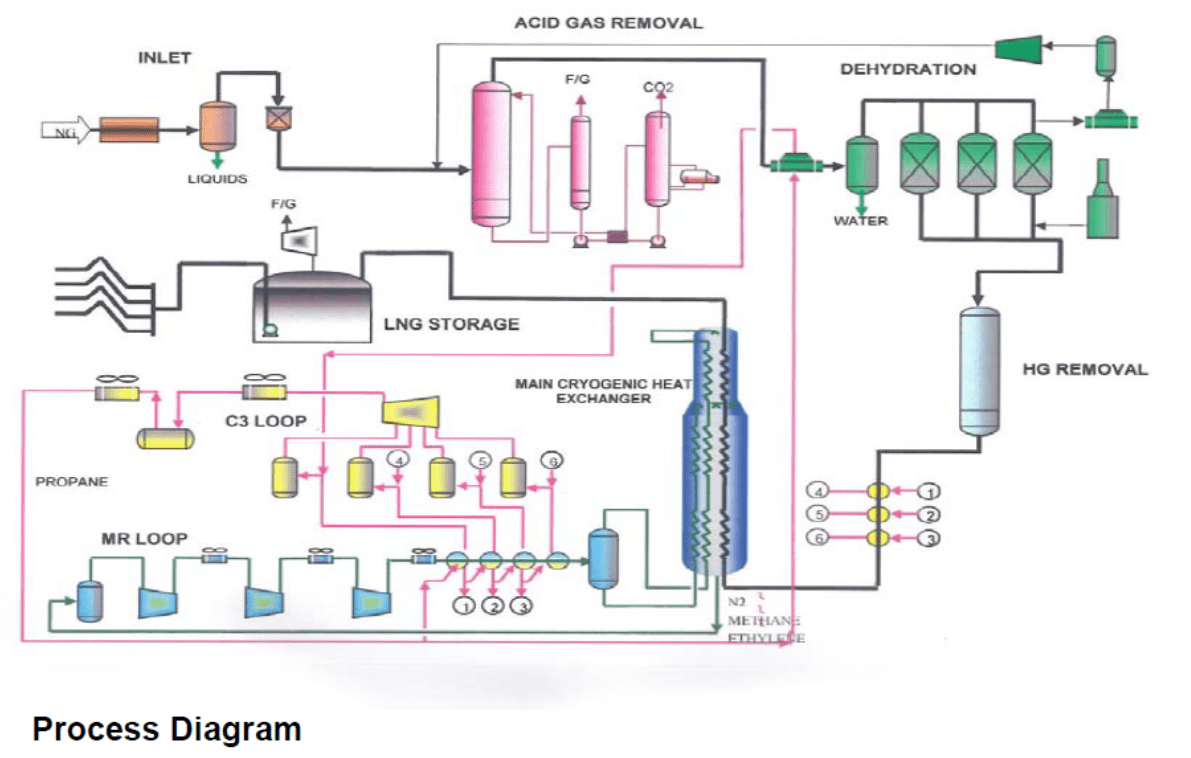
Two licensed architectures dominate the global LNG industry. The first is the propane-precooled mixed refrigerant process, known as C3MR, licensed by Air Products and Chemicals, Inc. A propane refrigerant loop precools the inlet gas from ambient to roughly minus 35 degrees Celsius. A mixed refrigerant of methane, ethane, propane, and nitrogen, in proportions tuned to the site’s specific gas composition and the local seasonal ambient profile, then condenses the gas to LNG at minus 162 degrees Celsius in a single brazed-aluminum spool-wound heat exchanger of the kind only Air Products and a small number of competitors can fabricate. C3MR is the dominant US technology, used at Sabine Pass, Cove Point, Cameron LNG, and Corpus Christi.
The second is the ConocoPhillips Optimized Cascade, in which three separate pure-refrigerant loops, propane, ethylene, and methane, provide the cascade cooling. Optimized Cascade is used at Freeport LNG and at Elba Island. It is generally more capital-intensive than C3MR per million tonnes of capacity but more flexible at off-design ambient conditions and has historically achieved high availability. The Bechtel-built Atlantic LNG plant in Trinidad, the original 1999 commercial reference for the technology, used Optimized Cascade trains licensed under the same architecture.
Mid-scale modular trains, the architecture pioneered by Venture Global, use a single mixed refrigerant loop, simpler than C3MR or Optimized Cascade, with a per-train capacity of 0.6 to 1.2 million tonnes per annum (MTPA) instead of the 4 to 6 MTPA of conventional mega-trains. Venture Global builds 18 mid-scale trains at Calcasieu Pass and 36 at Plaquemines, manufactured at the Baker Hughes Houston facility under fabrication-yard conditions and barged to site for installation. The modularization trade is faster construction and lower per-train risk in exchange for more equipment per million tonnes of capacity. The argument from Venture Global’s perspective is that schedule certainty and capital flexibility outweigh the unit-cost penalty.
The plant also includes pretreatment, in chemistry identical to the gas processing plant of Chapter 9. Acid gas removal extracts CO2 and H2S in an amine absorber. Dehydration extracts water in a molecular sieve dryer. Mercury removal extracts trace mercury that would otherwise embrittle the brazed-aluminum heat exchanger downstream. Feedgas compression boosts the cleaned, dried gas to liquefaction inlet pressure of roughly 600 to 700 psig. End-flash recovery captures the small fraction of nitrogen and lighter components that flash off as the LNG approaches storage conditions. Storage is in vacuum-insulated full-containment tanks of typically 160,000 to 200,000 cubic meters each, sized for one to two cargos worth of inventory. Boil-off gas, the small fraction of LNG that gasifies in the tank from ambient heat ingress, is recompressed and either burned as plant fuel or reliquefied in dedicated equipment. The plant burns roughly 8 to 10 percent of its feedgas as fuel for the refrigeration compressors and the pretreatment heaters; the residual is what reaches the tanker. The number on the wholesale invoice is feedgas times Henry Hub plus the tolling fee, but the molecules that actually leave the dock are the residual after the plant feeds itself.
The Eight US Operating LNG Terminals
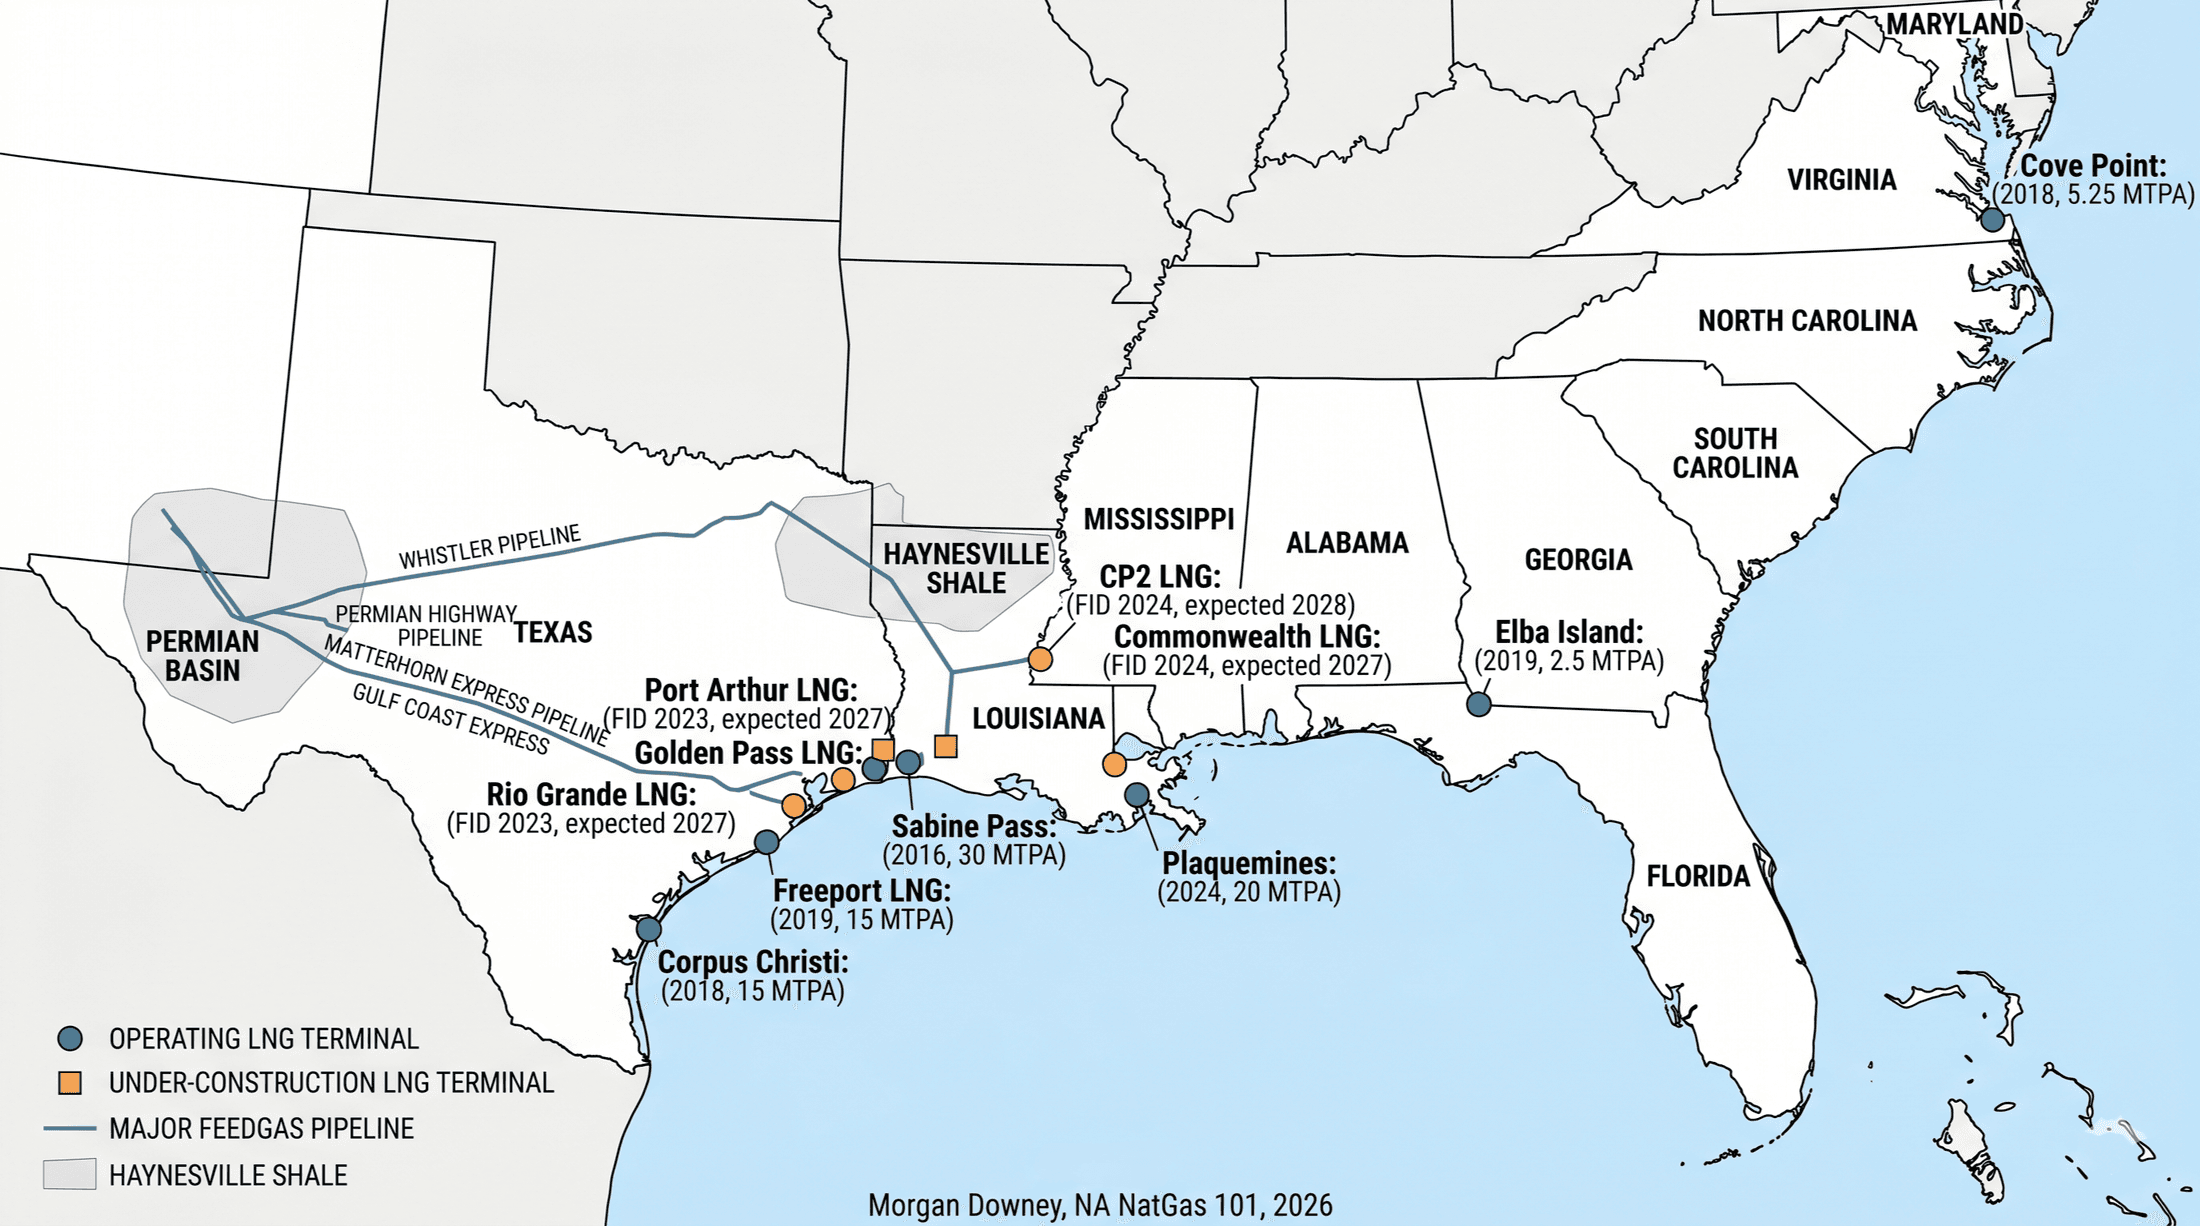
Eight US LNG export terminals are in commercial service as of early 2026. They sit on three coastlines: the Gulf of Mexico from Brownsville to the Florida panhandle, the Chesapeake Bay, and the Atlantic coast of Georgia.
Sabine Pass, operated by Cheniere, is the largest. Six liquefaction trains in Cameron Parish, Louisiana, with a combined nameplate of approximately 30 MTPA. First cargo February 2016. Sabine Pass alone consumes roughly 4.3 Bcf/d of feedgas at full utilization, more than the gas consumption of any single US state outside Texas, Louisiana, and Pennsylvania.
Cove Point, in Lusby, Maryland, on the Chesapeake Bay, is the only operating US LNG export terminal outside the Gulf and Atlantic coasts. One liquefaction train of approximately 5.25 MTPA. First cargo March 2018. The site began operation in 1978 as an import terminal, was mothballed from 1980 to 2003 in response to the post-1970s collapse in US LNG import economics, restarted as an importer from 2003 to 2014, and was then converted to bidirectional service with the addition of liquefaction in 2018. Berkshire Hathaway Energy bought the asset from Dominion Energy in 2020.
Cameron LNG, in Hackberry, Louisiana, is a joint venture of Sempra Infrastructure, Mitsui, Mitsubishi, and Total, with three trains and approximately 13.5 MTPA of nameplate. First cargo May 2019.
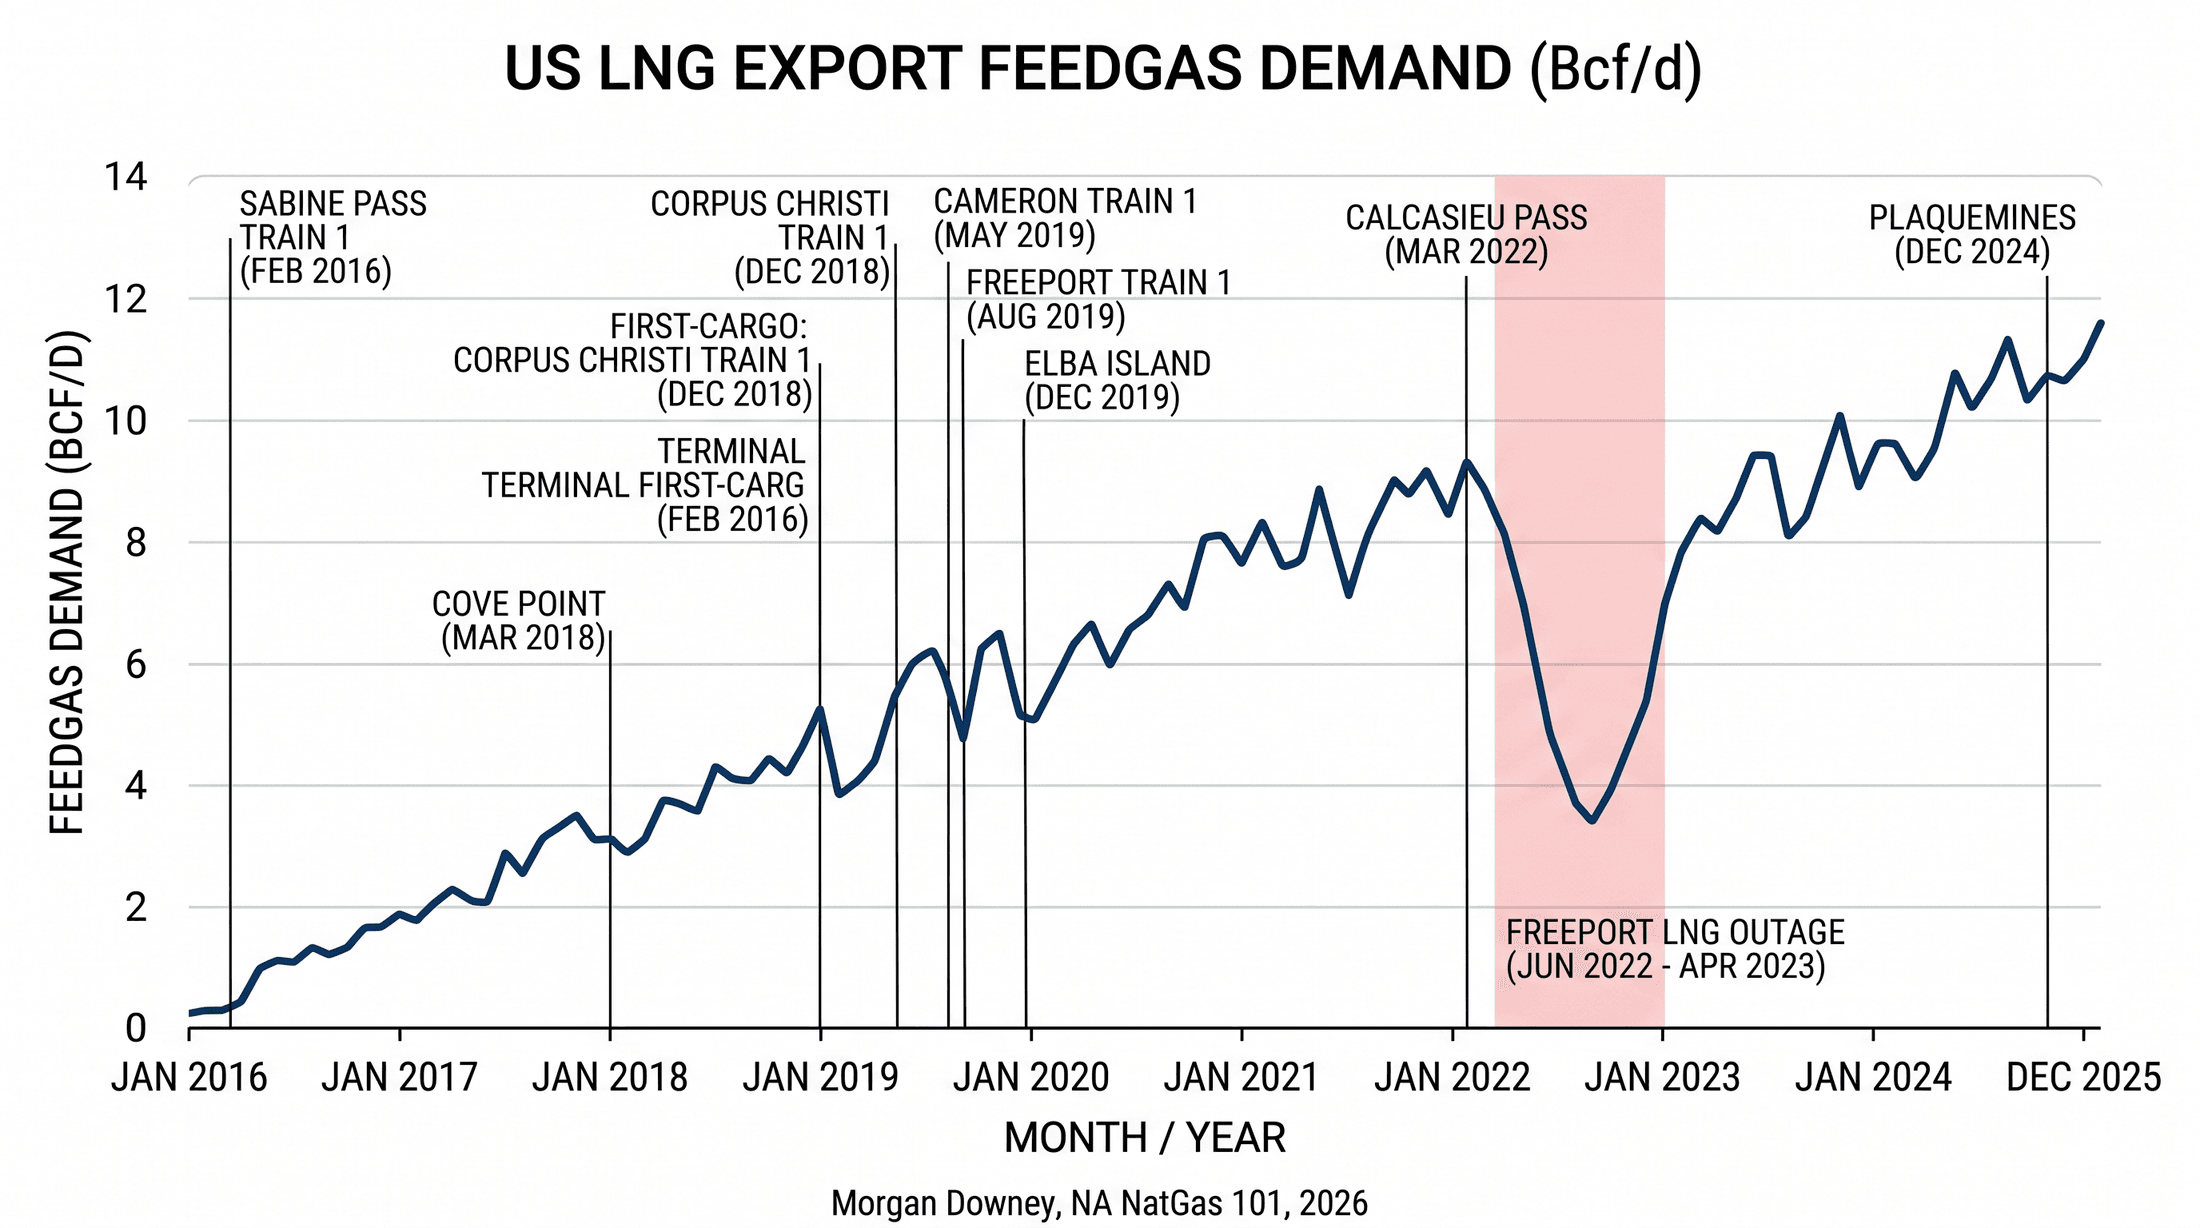
Freeport LNG, on Quintana Island in Texas, has three trains and approximately 15 MTPA of nameplate. First cargo September 2019. The plant suffered a pipe rupture and cryogenic gas release at the pretreatment unit on Wed Jun 8, 2022, that took the entire facility offline for eight months and removed roughly 2 Bcf/d of US export volume from the global market at the height of the European energy crisis.
Corpus Christi, also operated by Cheniere, sits at La Quinta Channel in San Patricio County, Texas. Three operational mega-trains commissioned through 2018 to 2019, plus the Stage 3 mid-scale expansion of seven additional 1.49 MTPA modular trains coming online from 2024 to 2026. First cargo December 2018.
Elba Island, operated by Kinder Morgan in Chatham County, Georgia, is the smallest of the eight. Ten mid-scale trains, each a Movable Modular Liquefaction System unit licensed from Shell, with a combined nameplate of approximately 2.5 MTPA. First cargo December 2019.
Calcasieu Pass, operated by Venture Global in Cameron Parish, Louisiana, opened in 2022 with a configuration that has no precedent in the US industry: 18 mid-scale modular trains, each rated 0.626 MTPA, manufactured at the Baker Hughes Houston yard and barged to site. First cargo Wed Mar 2, 2022, six days after the Russian invasion of Ukraine. The facility’s commissioning sequence has been the subject of substantial litigation: long-term sale-and-purchase customers including Shell, BP, Edison, and Repsol have filed disputes alleging that Venture Global elected to sell commissioning cargoes into the spot market at prices well above the long-term contract price for as long as three years before declaring commercial operation.
Plaquemines, also operated by Venture Global, in Plaquemines Parish, Louisiana, opened in late 2024 with the same modular architecture scaled up to 36 trains and approximately 20 MTPA at full commissioning. First cargo December 2024.
Total US LNG export feedgas demand reached approximately 14 Bcf/d in 2024, against zero in 2015. The pace of buildout has been roughly 2 Bcf/d of additional feedgas demand per year from 2016 through 2024. Another 5 to 7 Bcf/d is contracted to come online from 2024 through 2027 from Plaquemines ramp-up, Corpus Christi Stage 3, Rio Grande LNG, Port Arthur LNG, and Plaquemines Phase 2. The shore plant is the bottleneck, and the shore plant is doubling.
The LNG Tanker Fleet
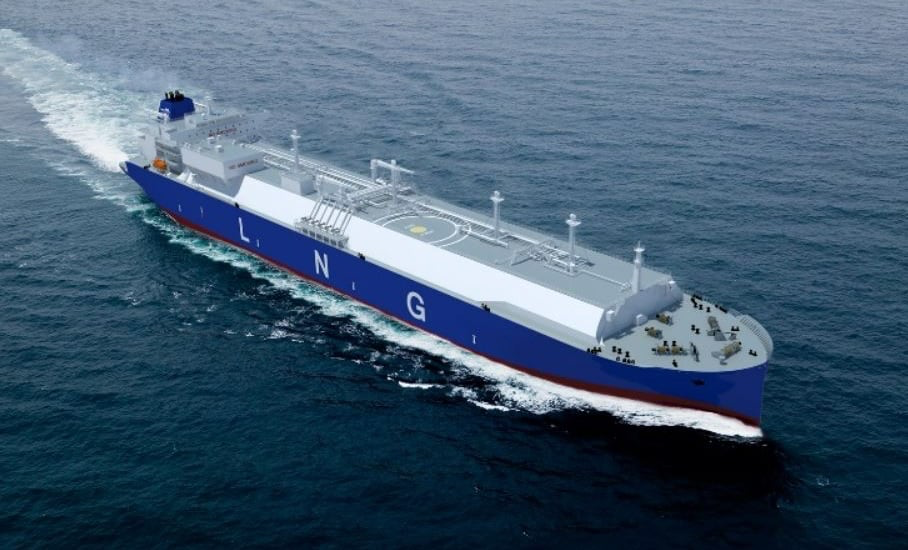
LNG ships in purpose-built tankers with cryogenic containment systems built to maintain minus 162 Celsius cargo for a fifteen-day Pacific transit. Two architectures dominate the global fleet.
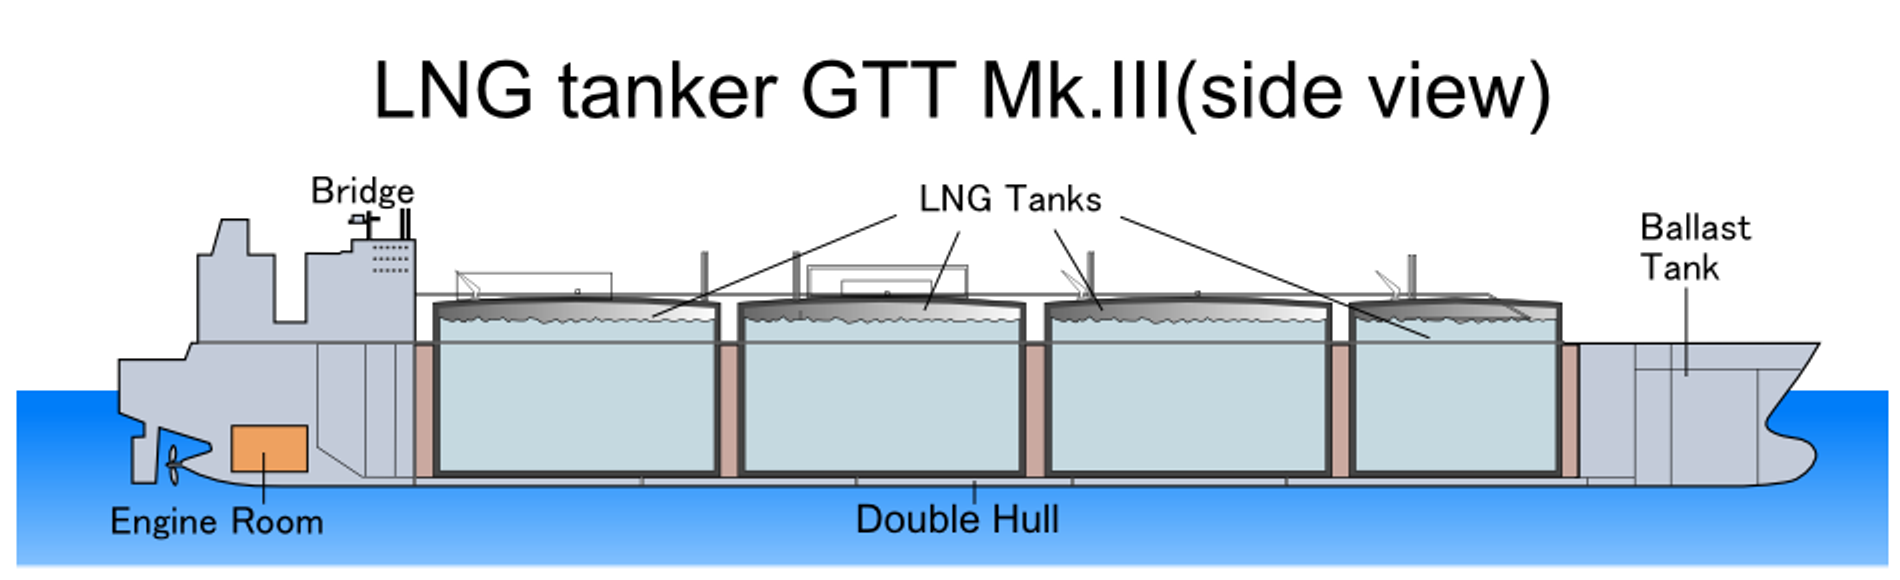
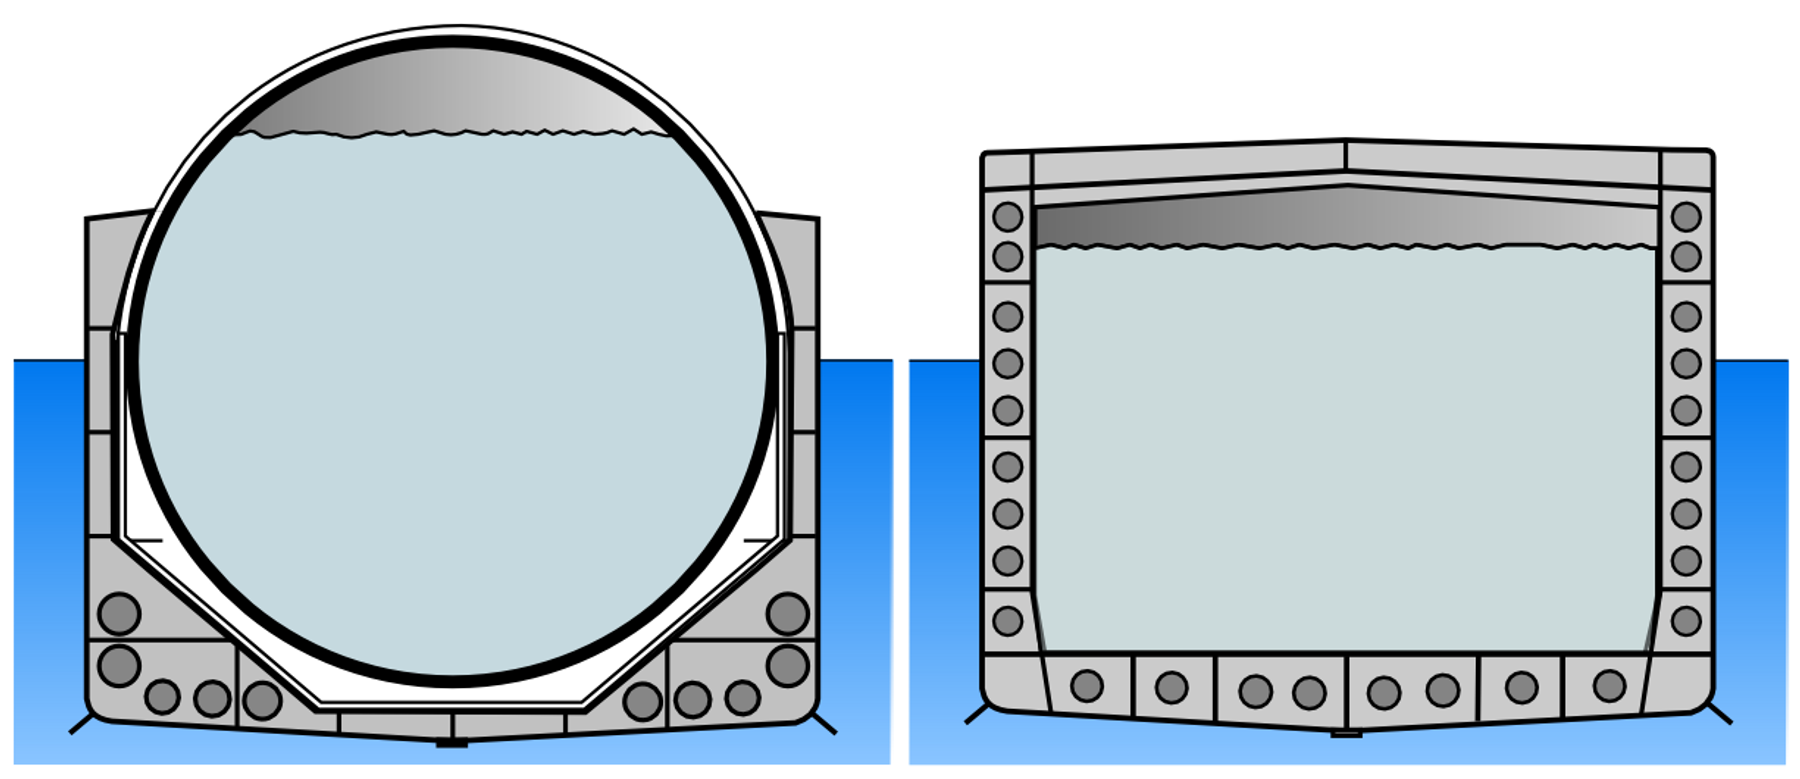
Membrane containment is the modern standard. GTT (Gaztransport et Technigaz, the French licensor that consolidated the prior Gaztransport and Technigaz technologies) has approximately 80 percent of the global membrane fleet share through its Mark III and NO96 systems. The architecture uses a thin steel or invar nickel-iron alloy primary barrier separated from the ship’s hull by polyurethane-foam or balsa-wood insulation, with a secondary barrier of similar construction inside the hull frame. Membrane tankers have a flat-deck profile and a cargo capacity of typically 160,000 to 174,000 cubic meters of LNG, equivalent to roughly 3.4 to 3.6 Bcf of regasified gas per cargo. The flat-deck profile lowers the air draft for canal and bridge clearance and provides deck space for the manifold and the boil-off-gas piping.
Moss spherical containment is the alternative. Five large insulated spherical tanks of aluminum alloy rise above the deck of the ship, each supported by a cylindrical steel skirt. The system was designed by Kvaerner Moss in Norway in the 1970s and dominated new builds through the 1980s and 1990s. It has been gradually displaced by membrane on new construction since approximately 2010 because membrane provides higher cargo capacity in the same hull dimensions. Moss tankers are still in service in substantial numbers, particularly in the Japanese trade, but the new-build order book is overwhelmingly membrane.
Propulsion has evolved through three generations. Steam turbine, the legacy architecture dominant before 2010, used the LNG boil-off gas as boiler fuel with heavy fuel oil as supplemental fuel; thermal efficiency was low but the boil-off gas was effectively free, so the operating economics worked. Dual-fuel diesel-electric (DFDE), the dominant new-build architecture from roughly 2010 to 2015, used medium-speed engines burning either boil-off gas or fuel oil to generate electricity that drove the propellers through electric motors; thermal efficiency was substantially higher than steam. ME-GI and X-DF dual-fuel two-stroke engines have dominated new builds since approximately 2018; MAN Energy Solutions’ ME-GI and Wartsila / WinGD’s X-DF are two-stroke engines that burn natural gas directly with a small pilot fuel at near-marine-diesel efficiency. The two-stroke architecture is dominant on new builds for the same reason it dominates other large-vessel new builds: lower fuel consumption per nautical mile.
The global LNG tanker fleet was approximately 700 ships at end of 2024 and growing rapidly with new build orders driven by the US, Qatari, and Mozambican LNG export capacity additions through 2030. QatarEnergy’s QC-Max series, the largest LNG tankers ever ordered, with capacity above 270,000 cubic meters per ship, are under construction at Korean and Chinese yards for the North Field expansion. The fleet is no longer the bottleneck. The shore plant is.
The Contractual Architecture
LNG export sales are structured under three contract templates, each with a distinct allocation of price risk among feedgas seller, terminal operator, and final cargo buyer.
Tolling is the architecture that financed Cheniere. The customer, typically a producer or marketer, supplies feedgas to the terminal, pays a fixed liquefaction tolling fee per MMBtu, and receives the LNG less plant fuel and shrinkage. The terminal operator takes no commodity exposure: revenue is the toll fee multiplied by contracted volume, regardless of where Henry Hub or the destination market price prints. Long-term tolling contracts run 15 to 25 years and underwrite the project debt. Cheniere’s Sabine Pass and Corpus Christi terminals operate primarily under this model. The customer base is global, with BG Group (now Shell), Total, Naturgy, Korea Gas, GAIL India, and Centrica as the original Sabine Pass tolling counterparties.
Henry Hub-linked sale and purchase, the dominant template for new US projects since approximately 2015, prices LNG to the buyer at a formula structured as 115 percent of Henry Hub plus a fixed liquefaction fee, free on board (FOB) at the terminal jetty. The terminal operator buys the feedgas at Henry Hub plus a basis differential, runs it through the plant, and sells the LNG at the formula price. The buyer takes the price risk between the Henry Hub-linked LNG cost and the destination market price. The 115 percent multiplier on Henry Hub is the industry-standard reflection of the plant fuel and shrinkage inside the formula, calibrated so the seller breaks even on commodity throughput and the tolling fee covers the project return. The $2.25 to $3.50 per MMBtu range commonly seen for the fixed liquefaction fee on US contracts since 2014 is calibrated to capital costs of roughly $800 to $1,200 per tonne of nameplate capacity for mega-trains and somewhat higher for modular trains.
Oil-indexed long-term sale and purchase, structured as a percentage of Brent crude on a per-MMBtu basis, is the dominant architecture for legacy Qatari, Australian, and Trinidadian LNG supplies. The historical formula was 14 to 17 percent of Brent for buyers in Northeast Asia, where the oil-LNG link reflected the 1970s-era logic that LNG would compete with crude in power generation and the buyer needed price symmetry with substitute fuels. The percentage has compressed to 11 to 13 percent of Brent on contracts signed since approximately 2015, reflecting the structural decoupling of US gas (Henry Hub) from oil (Brent) since the 2009 shale-gas inflection. New US project contracts, with rare exceptions, are not Brent-indexed; the producer cost stack is Henry Hub, the marketer’s incentive is to price the LNG to that cost stack, and the buyer’s incentive (after the lessons of 2014 and 2020) is to diversify away from crude-linked exposure.
Spot and short-term LNG trade has grown from under 10 percent of total global LNG by volume in 2010 to roughly 35 to 40 percent of the trade in 2024. The TTF Dutch Title Transfer Facility front-month gas hub has become the price benchmark for spot LNG delivered into Europe. The S&P Global Platts JKM (Japan-Korea-Marker) assessment, a daily survey of buyer-seller bids and offers for LNG cargoes delivered to Northeast Asia for delivery four to six weeks forward, has become the price benchmark for spot LNG into Asia. Cheniere reported approximately $33 billion in 2022 revenue, a record, with cargo-margin averages well above the prior long-term contract base of $1 to $2 per MMBtu.
FERC and DOE Permitting
LNG export terminals require dual federal authorization. FERC under Section 3 of the Natural Gas Act authorizes the construction and operation of the LNG terminal infrastructure: the liquefaction trains, the storage tanks, the pier, and the feedgas pipeline interconnect. The Department of Energy’s Office of Fossil Energy and Carbon Management authorizes the export of LNG to specific destination countries, also under Section 3 of the Natural Gas Act, on a separate track from the FERC siting docket.
The DOE export authorizations are structured in two categories. Free Trade Agreement (FTA) authorizations cover exports to countries with which the United States has a free trade agreement that includes natural gas trade obligations: South Korea, Japan (under the 2020 US-Japan Trade Agreement, with separate gas-specific provisions), Singapore, Mexico, Canada, Chile, and the other US FTA partners. Under the Natural Gas Act, DOE must grant FTA authorizations without further public-interest review. Non-FTA authorizations cover exports to all other countries, including most major European importers, China, and India. DOE conducts a public-interest review before granting non-FTA authorization, considering domestic energy supply, price effects, balance of trade, employment, and environmental factors. The non-FTA authorization is the binding constraint: the buyers willing to pay for long-term, reliable LNG supply are largely in non-FTA jurisdictions in Europe and Asia.
On Fri Jan 26, 2024, the Biden administration announced a pause on new non-FTA export authorizations pending an updated public-interest review that would explicitly consider greenhouse gas emissions, energy affordability, and national security. Several pending applications, including CP2 LNG (Venture Global, the planned 20 MTPA second-phase Calcasieu Pass expansion), Commonwealth LNG (Cameron Parish), and Lake Charles LNG (Energy Transfer), were left in regulatory limbo through the 2024 calendar year. The political response was sharp: the LNG industry argued that the pause was an effective embargo on new project finance, while environmental groups argued that the pause was a long-overdue recognition of the climate consequences of an unbounded export buildout.
On Mon Jan 20, 2025, on his first day in office, President Trump issued Executive Order 14154, “Unleashing American Energy,” rescinding the pause and directing DOE to resume non-FTA export authorizations. DOE issued conditional non-FTA approvals for several pending projects through the spring of 2025. CP2 LNG, Commonwealth LNG, and Delfin LNG received conditional authorizations during the second quarter of 2025.
The permitting architecture continues to be a binding constraint on the long-term US LNG export buildout. Each new project carries roughly $20 to $30 billion in capital cost and requires both FERC and DOE clearance plus four to seven years of construction. The terminals that come online from 2027 through 2030 were filed for FERC authorization between 2019 and 2022. The terminals filed for authorization in 2025 and 2026 will not produce a cargo before the 2030s.
The 2022 European Demand Surge
The Russian invasion of Ukraine on Thu Feb 24, 2022, began the structural inversion of European gas supply. Russian pipeline gas to Europe fell from approximately 155 billion cubic meters (Bcm) in 2021 to approximately 60 Bcm in 2022 to under 25 Bcm in 2023, a collapse from 40 percent of European supply to under 10 percent over two years. The replacement was a combination of LNG imports, primarily from the United States, and the demand destruction in industrial users covered in Chapter 13. US LNG exports to Europe rose from roughly 22 Bcm in 2021 to over 56 Bcm in 2022 to over 60 Bcm in 2023.
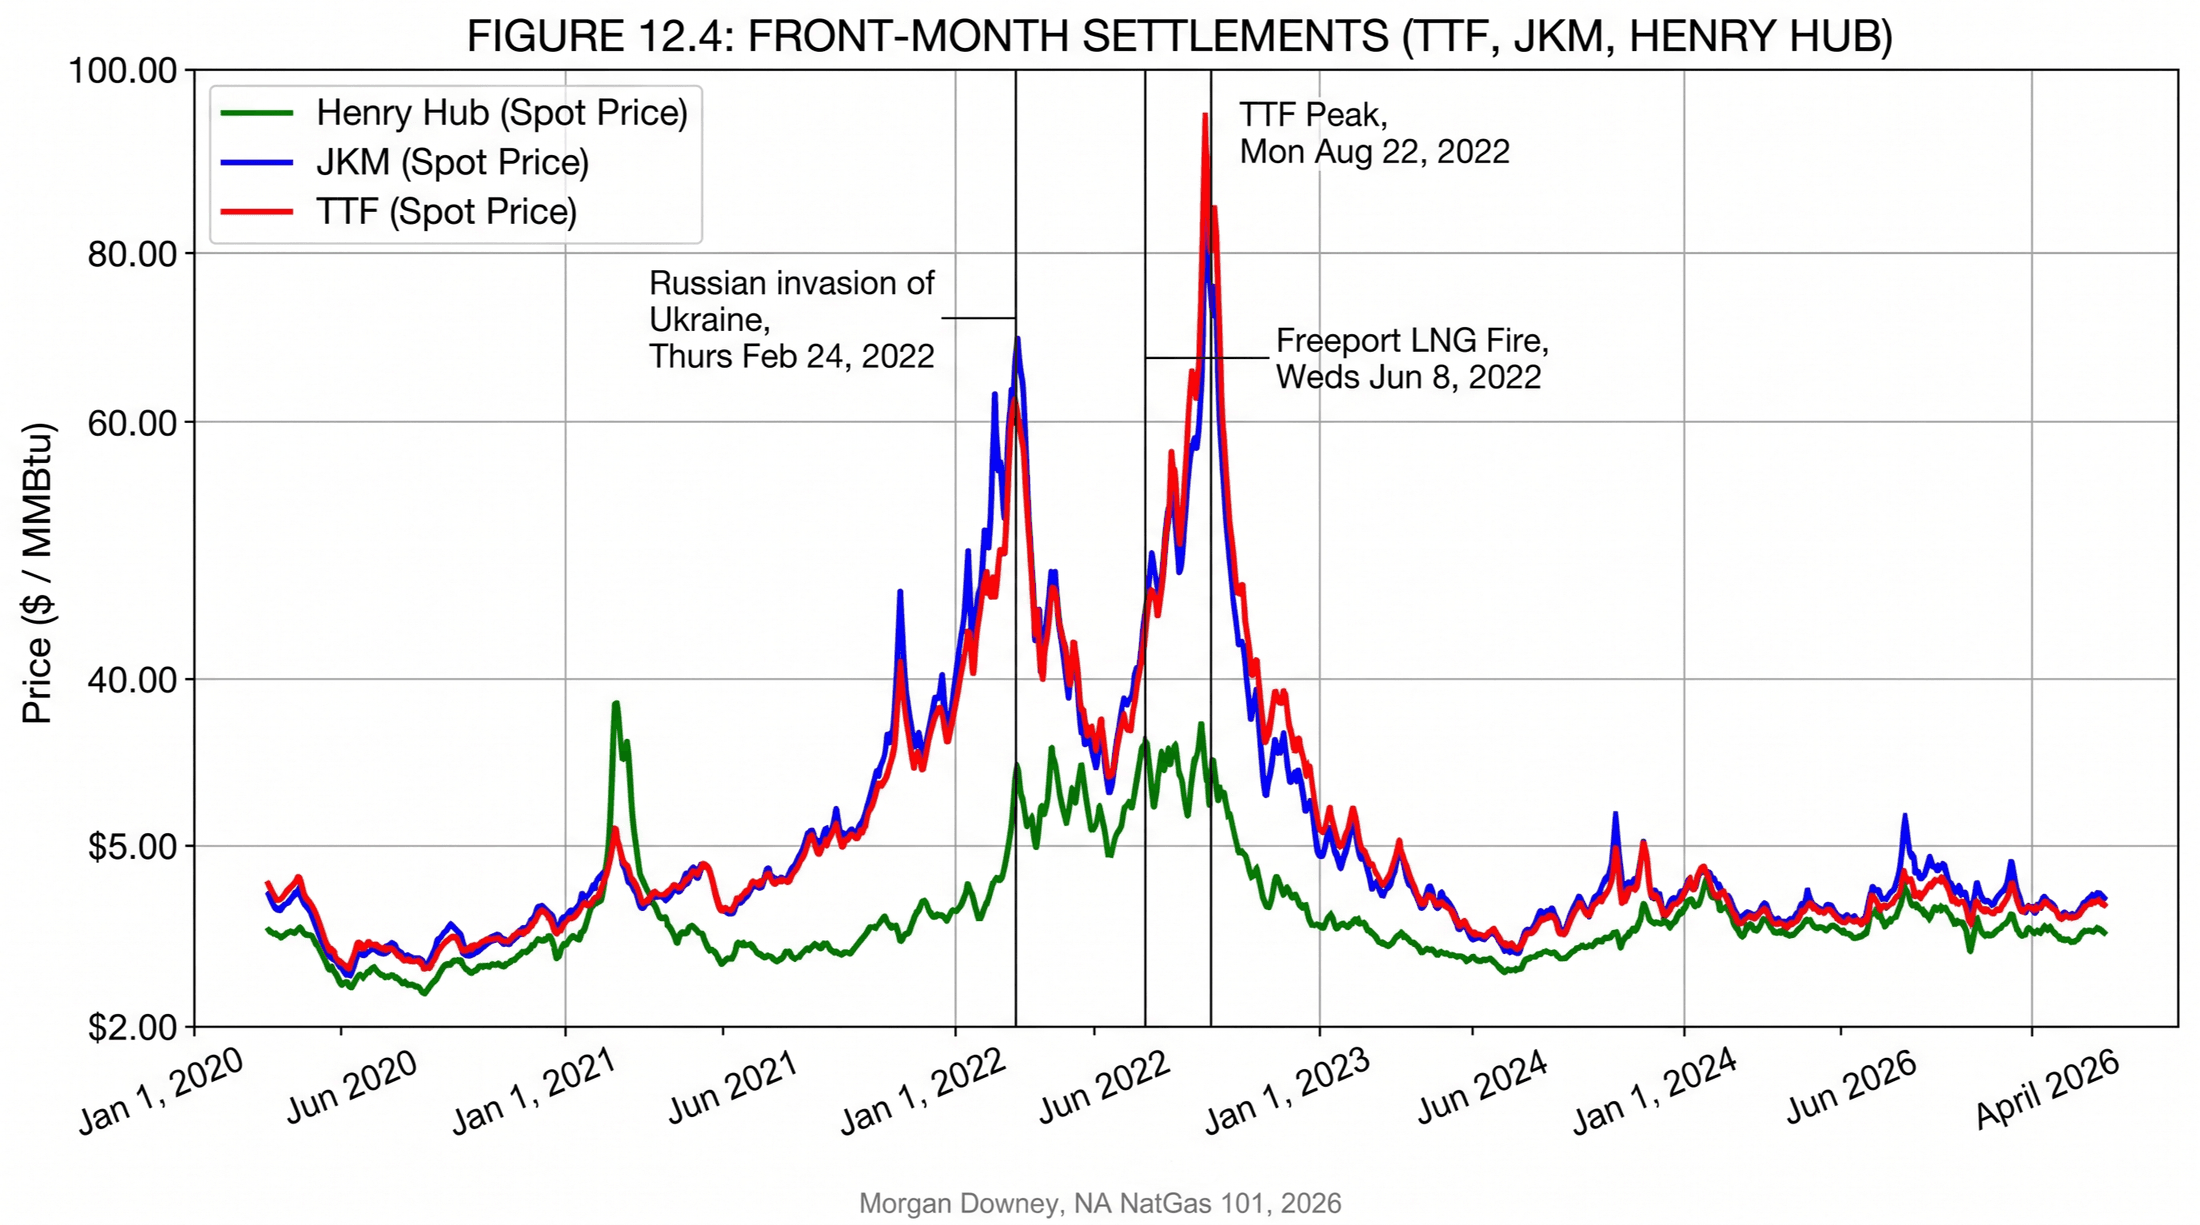
The price effects were severe. TTF, the Dutch front-month gas hub that emerged through the 2010s as the European spot benchmark, peaked above 300 euros per megawatt-hour on Fri Aug 26, 2022, equivalent to roughly $90 per MMBtu, against a pre-2021 historical range of 10 to 30 euros per MWh. JKM, the Northeast Asian spot benchmark, peaked above $80 per MMBtu in the same period as European cargoes outbid Asian buyers for marginal LNG supply. Henry Hub peaked at $9.85 per MMBtu on Tue Aug 23, 2022, the highest level since the 2008 spike.
The structural argument is that US LNG cargoes were the marginal supply in the global gas market through 2022 and 2023, and Henry Hub was the marginal cost reference for those cargoes. The European crisis transmitted directly into US gas prices through the LNG link. The Freeport LNG outage from June 2022 through January 2023 inverted that transmission temporarily: with 2 Bcf/d of US export capacity offline for eight months, Henry Hub dropped on the news (less feedgas demand at the wellhead) while TTF and JKM jumped (less LNG supply at the destination), and the spread between the two markets widened sharply on a single day in June 2022. The episode was the single clearest illustration of how deeply LNG export had integrated US gas markets into the global gas market over the prior decade.
The infrastructure response on the demand side was the rapid expansion of European LNG regasification capacity. Floating Storage and Regasification Units (FSRUs) deployed in Germany, Italy, the Netherlands, and Finland through 2022 and 2023 added approximately 50 Bcm per year of import capacity over 18 months, a buildout that would have taken five to seven years under conventional shore-based terminal construction timelines. The German FSRUs at Wilhelmshaven, Brunsbuttel, and Stade, the Italian FSRU at Piombino, the Dutch FSRU at Eemshaven, and the Finnish FSRU at Inkoo entered service through 2022 and 2023, all contracted to receive primarily US LNG cargoes. Europe rebuilt its gas-import architecture in 18 months. The cargoes that filled it had loaded at Sabine Pass, Cameron LNG, and Calcasieu Pass.
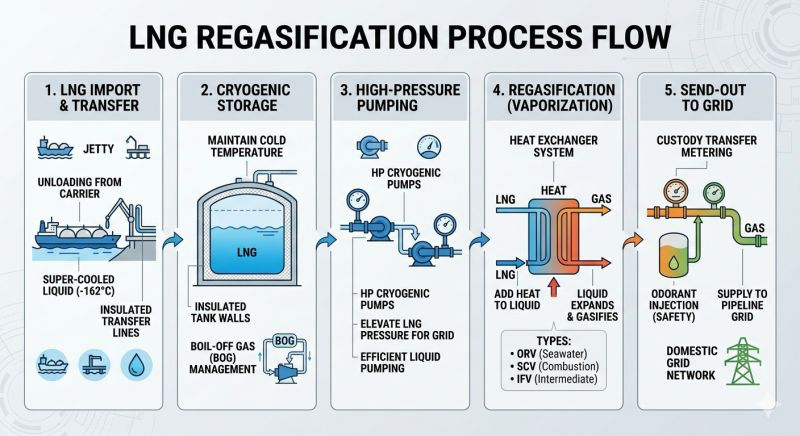
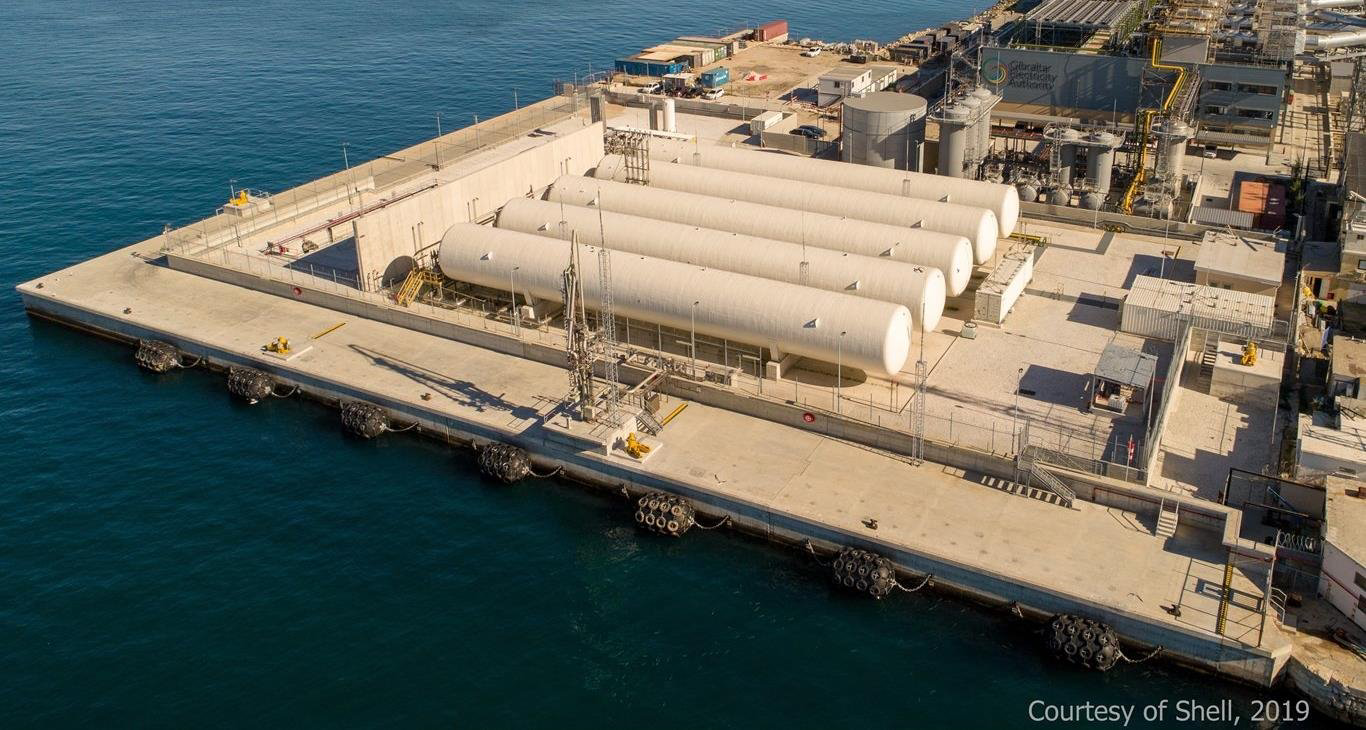
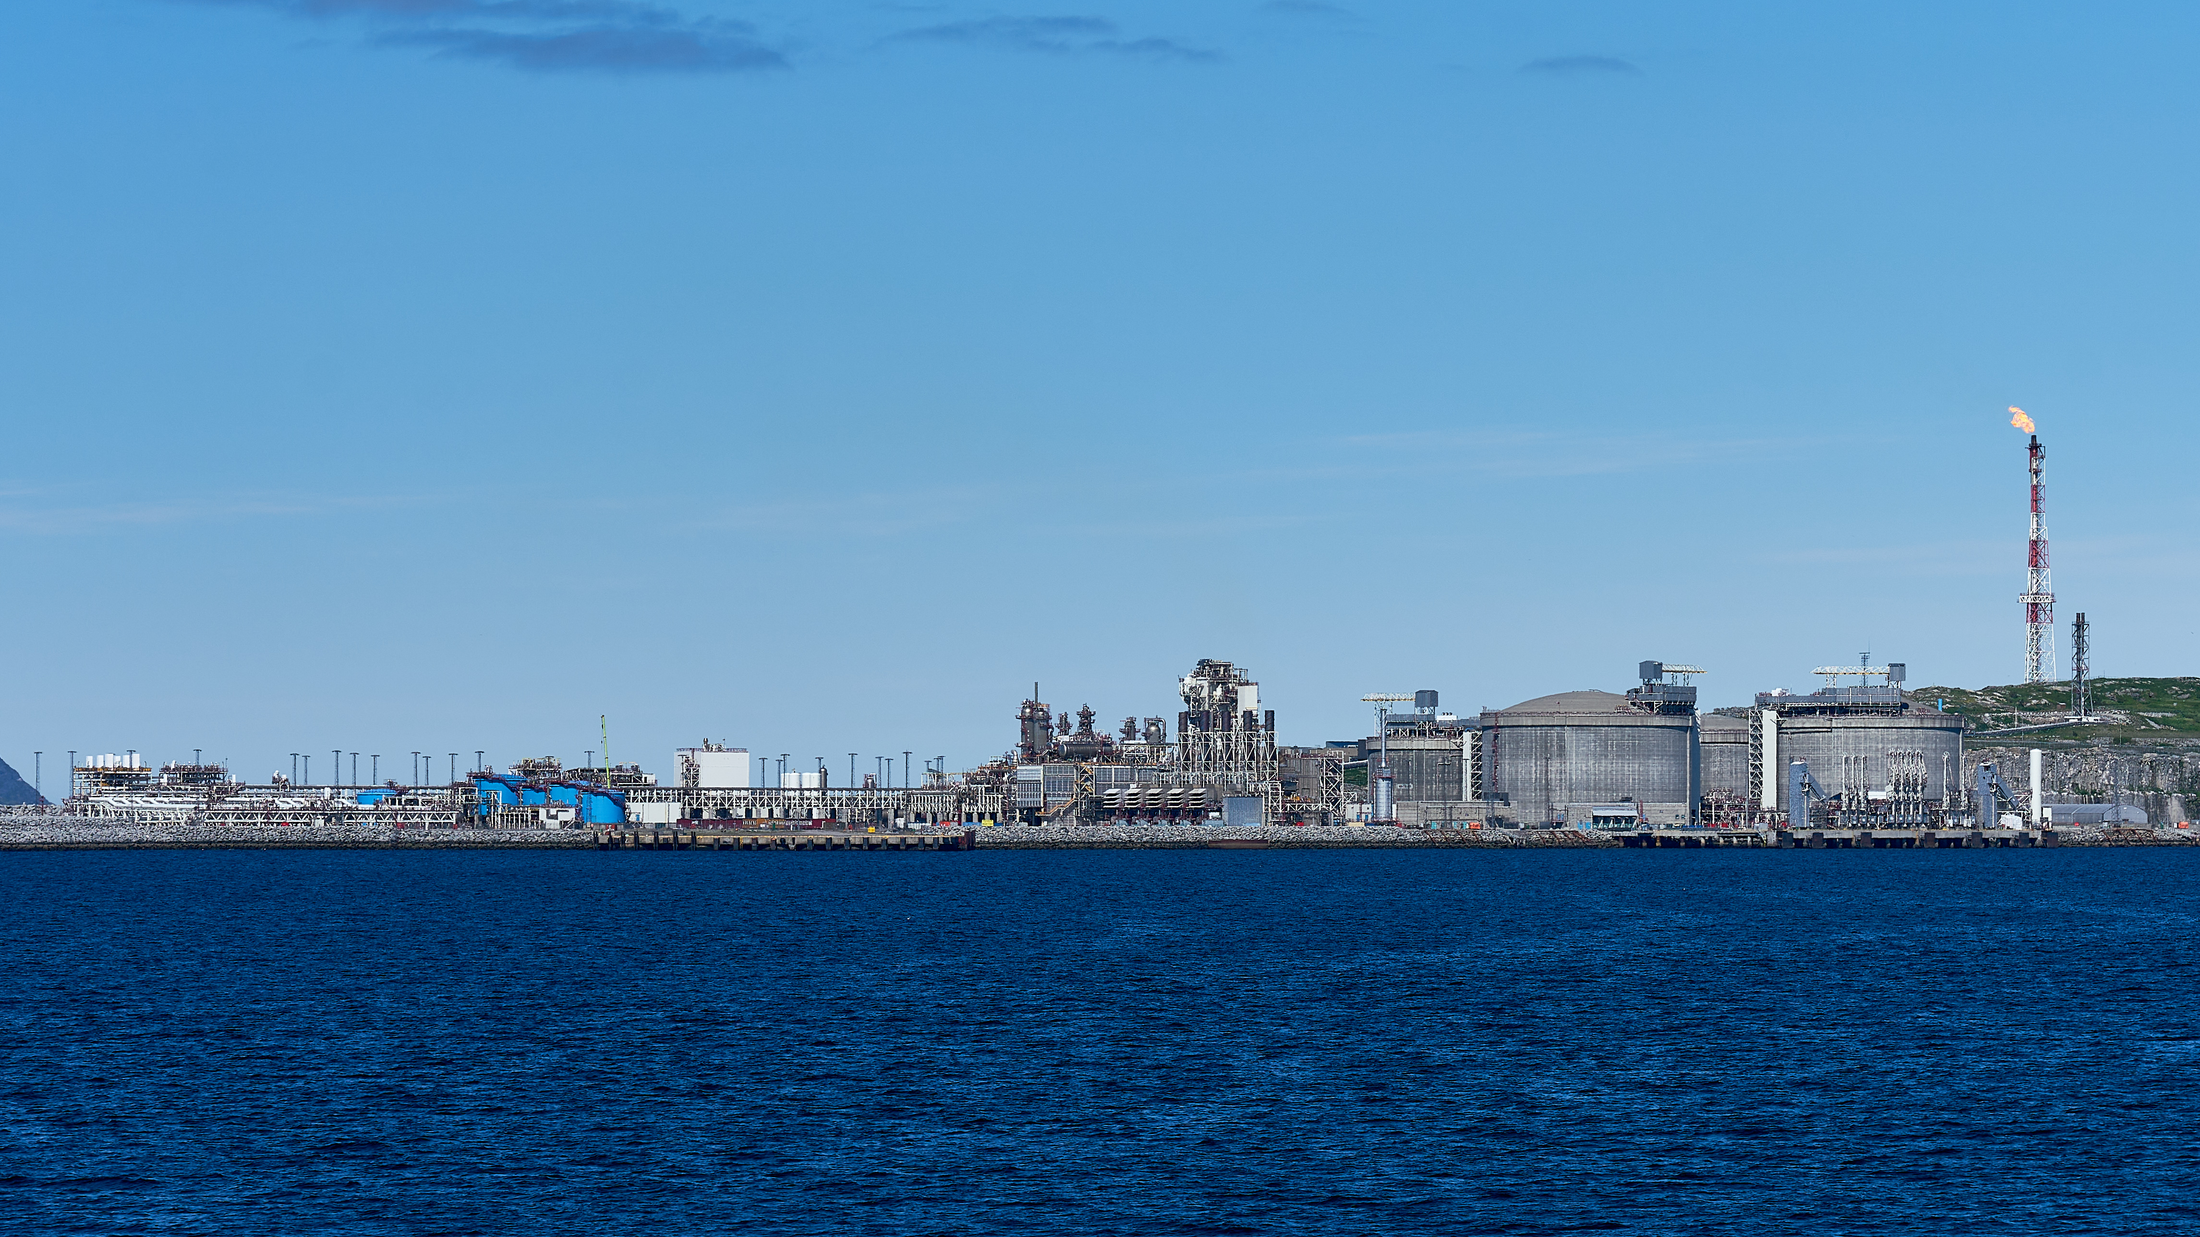
The 18-month versus five-to-seven-year contrast above reflects an architectural asymmetry. A regasification terminal is engineering-simple compared to a liquefaction terminal. Both share the cryogenic LNG storage tank as their most visible feature; the tanks are atmospheric-pressure double-walled vacuum-insulated vessels, not pressurized vessels, which is why an LNG terminal of either kind is recognizable from a distance by the cluster of large cylindrical or dome-roofed tanks at the coast. The difference is everything behind those tanks. A regasification plant needs storage, cryogenic pumps, a seawater or submerged-combustion vaporizer, and a custody-transfer meter, all of which can be assembled on a single barge and floated to a berth as an FSRU. A liquefaction plant needs a multi-stage refrigeration cascade with brazed-aluminum spool-wound heat exchangers, an acid-gas, dehydration, and mercury pretreatment train, full-containment storage, and large gas-turbine drivers for the refrigeration compressors. Per million tonnes of throughput, a liquefaction terminal costs roughly five to ten times what an equivalent regasification terminal costs.
The 80 to 130 megawatt gas-turbine drivers on the C3MR refrigeration compressors are the same machines used in baseload power plants and, since approximately 2023, in hyperscaler data centers. The 2024 to 2026 surge in gas-turbine orders from data center developers, combined with damage to Qatari North Field turbine equipment during the Strait of Hormuz crisis, has tightened global gas-turbine lead times to three to five years. GE Vernova, Siemens Energy, and Mitsubishi Power, the three qualified manufacturers of the heavy-frame H-class machines used on US LNG trains, are quoting delivery slots through 2030. Any LNG export project that has not already secured turbine slots is now schedule-constrained by the equipment supply chain rather than by the EPC contract.
The Capacity Buildout 2024-2030
US LNG export capacity at end of 2024 stood at roughly 14 Bcf/d of feedgas demand from the eight operating terminals. Capacity under construction or with FERC and DOE authorization in 2024 and 2025 includes: Plaquemines Phase 2 and the full ramp-up of Phase 1 (Venture Global), Corpus Christi Stage 3 (Cheniere), Rio Grande LNG Phase 1 (NextDecade, Brownsville, Texas, FID 2023), Port Arthur LNG Phase 1 (Sempra Infrastructure, FID 2023), and Golden Pass LNG (the ExxonMobil and QatarEnergy joint venture in the Sabine Pass area, FID 2019, expected first cargo 2025 to 2026). The cumulative buildout is expected to bring US LNG feedgas demand from 14 Bcf/d in 2024 to 25 to 30 Bcf/d by 2028 to 2030, making the United States by far the largest single LNG exporter in the world. Qatar, the prior leader, is expanding North Field capacity to approximately 16 Bcf/d of feedgas equivalent over the same horizon, but the US lead is structural rather than transient.
The supply-side response is the Permian and Haynesville takeaway pipeline buildout covered in Chapter 10: Whistler, Permian Highway, Matterhorn Express, Gulf Coast Express, and the Haynesville-to-Gillis trunk projects from DT Midstream, Momentum, and Williams. The Haynesville rig count and the Permian associated-gas growth that the LNG buildout depends on are the production-side inputs that occupy Chapters 6 through 9. The molecules leaving Sabine Pass on a January morning were drilled in the Haynesville two months earlier, gathered through Energy Transfer and Williams field systems, processed at a Targa or DCP cryo plant in northern Louisiana, and delivered to the terminal city gate on a Cheniere or Williams interstate trunk. The shore plant is the visible end of a continental supply chain that the prior chapters built out.
The Freeport Fire, June 8, 2022
At roughly 11:40 AM Central Daylight Time on Wed Jun 8, 2022, a section of LNG pipework at the Freeport LNG terminal on Quintana Island, Texas, ruptured at the boundary between the pretreatment unit and the cold box of Train 1. A cryogenic vapor cloud released and ignited. The fire was contained within minutes by the plant’s emergency systems, but the entire three-train facility was forced offline. At the time of the fire, Freeport was producing roughly 2 Bcf/d of US LNG export volume, or about 15 percent of total US LNG export capacity.
The market response was immediate. Henry Hub fell roughly 16 percent on the day, from above $9 per MMBtu to below $8, on the loss of 2 Bcf/d of feedgas demand at the wellhead. TTF rose roughly 18 percent on the same day, from roughly 80 euros per MWh to above 95, on the loss of European-bound cargoes that were already loading at the Quintana jetty. JKM rose by a similar percentage. The PHMSA investigation, completed in 2023, attributed the rupture to fatigue cracking in a section of piping that had been exposed to thermal cycling during commissioning and had not been inspected since. Freeport returned the first train to service in February 2023 and the full facility to commercial operation by April 2023.
The episode was the cleanest single demonstration of how deeply LNG export had integrated US gas markets into the global market: a pipe rupture at a single Texas terminal moved European front-month gas more than the average daily move of the prior decade.
The LNG complex closes the demand-side accounting that Chapters 12 and 13 began. Chapter 15 turns to the price layer that runs underneath all of these flows: the pricing hubs and basis differentials that translate molecules at the wellhead into prices at the city gate, the LNG terminal jetty, and the Asian and European destination markets.