Industrial and Residential Demand
Petrochemical feedstock, fertilizer manufacture, residential heating, the heating degree day, and the appliance fleet that locks gas demand into the building stock.
On Mon Aug 22, 2022, BASF’s Ludwigshafen complex on the upper Rhine, the largest integrated chemical site in the world at roughly 10 square kilometers and 200 production plants, announced an indefinite curtailment of ammonia production at its two on-site Haber-Bosch units, citing natural gas costs above 250 euros per megawatt-hour at the Title Transfer Facility hub in the Netherlands. Yara, the Norwegian fertilizer company that operates the largest single network of European ammonia capacity, had already curtailed roughly 65 percent of its European ammonia capacity through the prior month. CF Industries’ UK ammonia plant at Billingham had idled in September 2021 and never restarted commercially. By autumn 2022, more than 70 percent of European ammonia and urea capacity was offline.
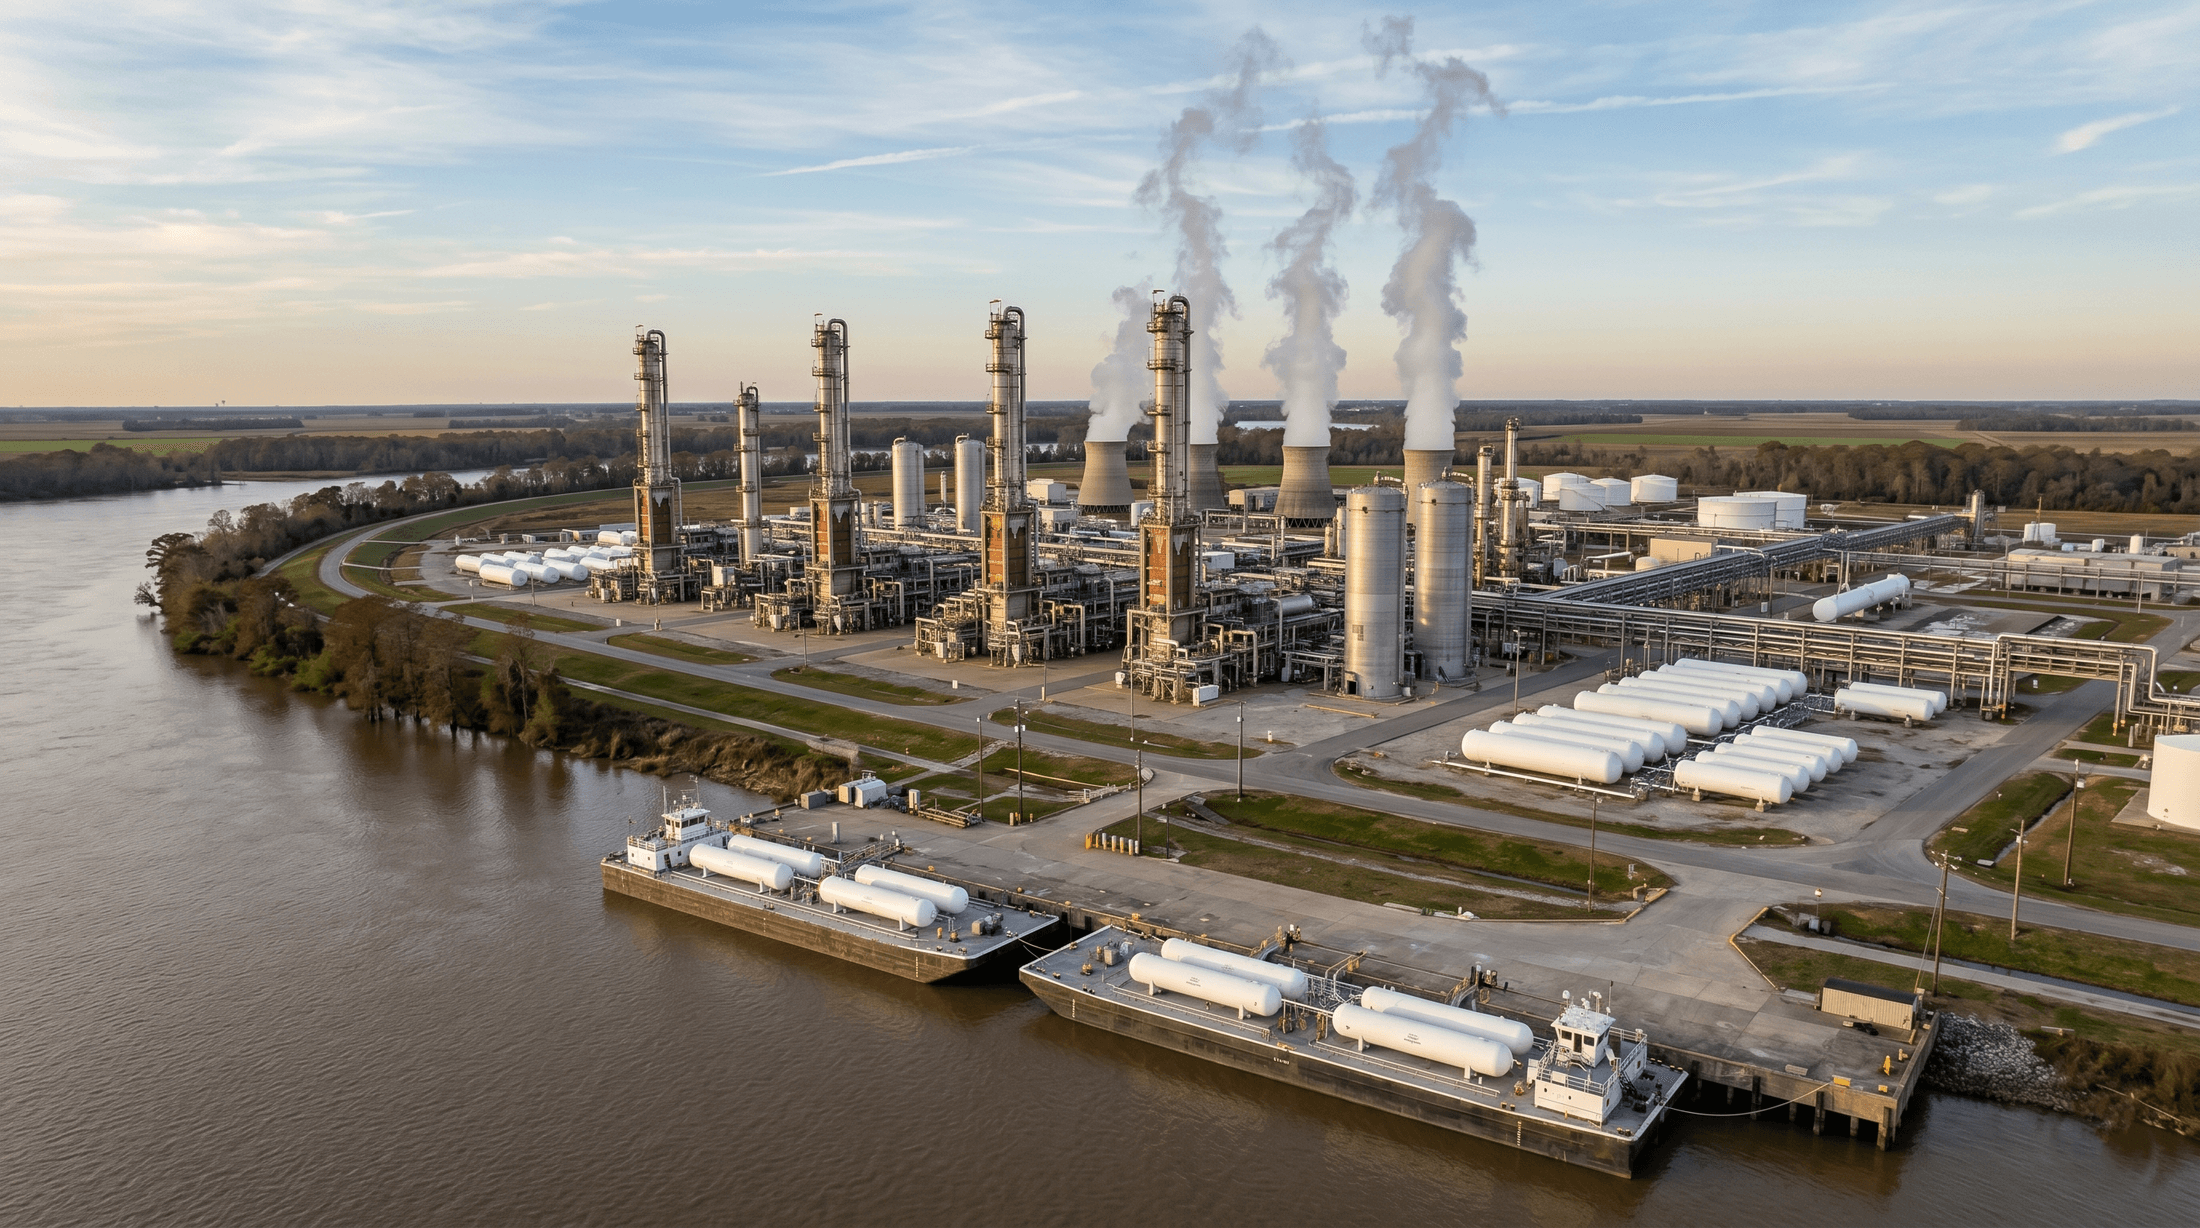
The same week BASF announced its Ludwigshafen curtailment, CF Industries’ Donaldsonville complex on the Mississippi River 60 miles upstream from New Orleans was running its 4.0-million-tonne-per-year ammonia and urea capacity at full rates. Henry Hub spot was settling near $9 per MMBtu, the highest sustained level since 2008, but the unit economics still cleared at full output because European urea was netting back well above $1,000 per tonne FOB Gulf. CF’s 2022 net earnings reached $3.4 billion, against $917 million in 2021. The Brazilian and Indian buyers who had previously cleared at European ports redirected their cargoes to Donaldsonville, Verdigris, Yazoo City, and Port Neal. Henry Hub priced the marginal molecule of synthetic nitrogen on every continent that summer.
The chapter that follows is the industrial and residential half of the US gas demand stack: the chemistry that turns methane into food, the process heat that turns it into glass and steel, the residential furnace fleet that swings demand by an order of magnitude between summer and winter, and the LDC utility model that delivers the molecules to 70 million American households.
The Shape of US Gas Demand by Sector
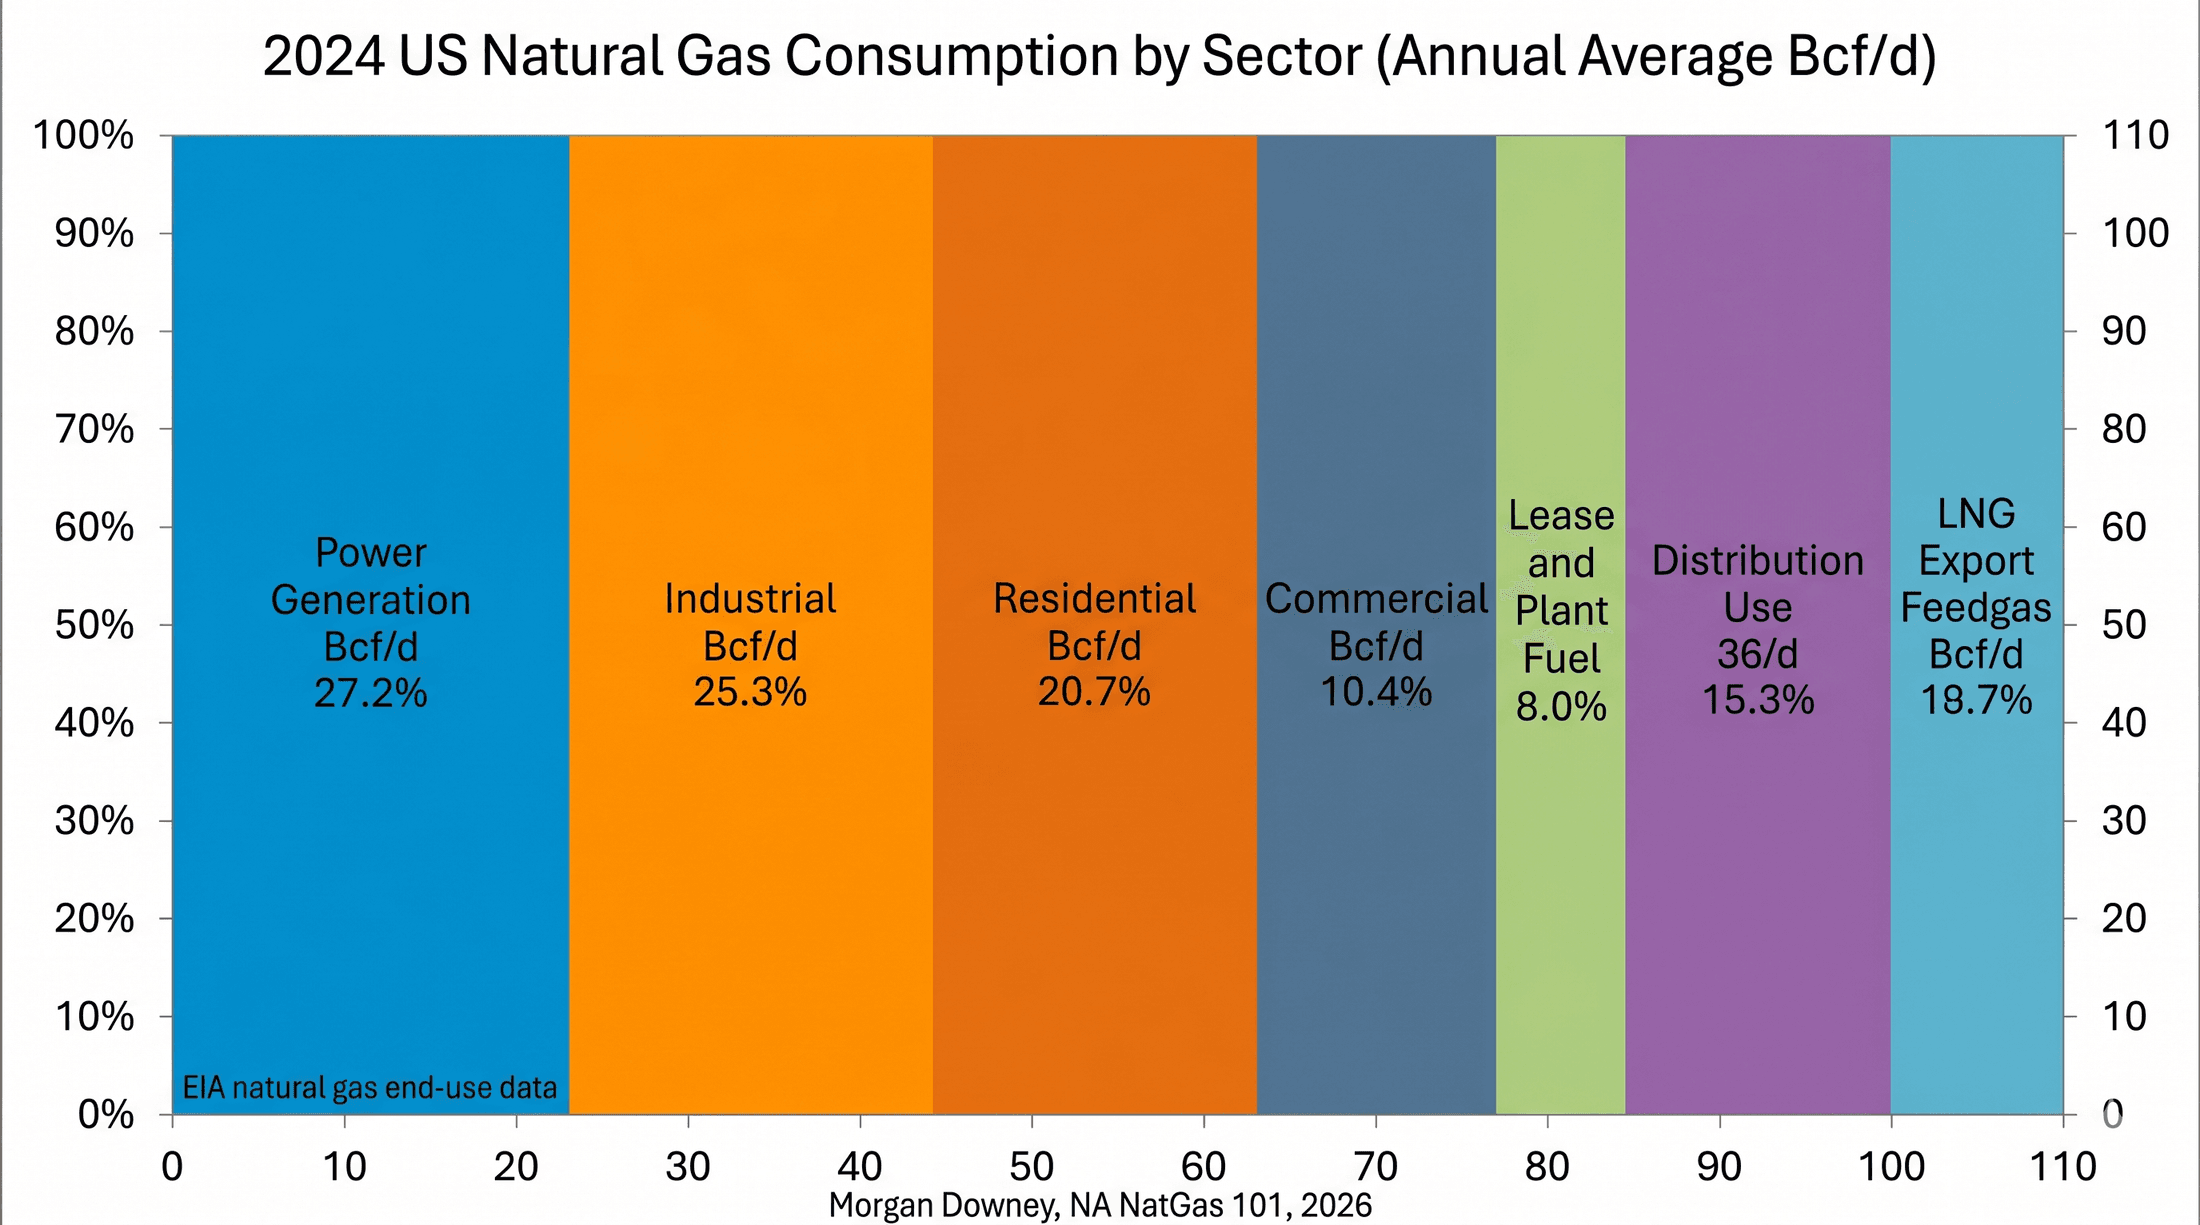
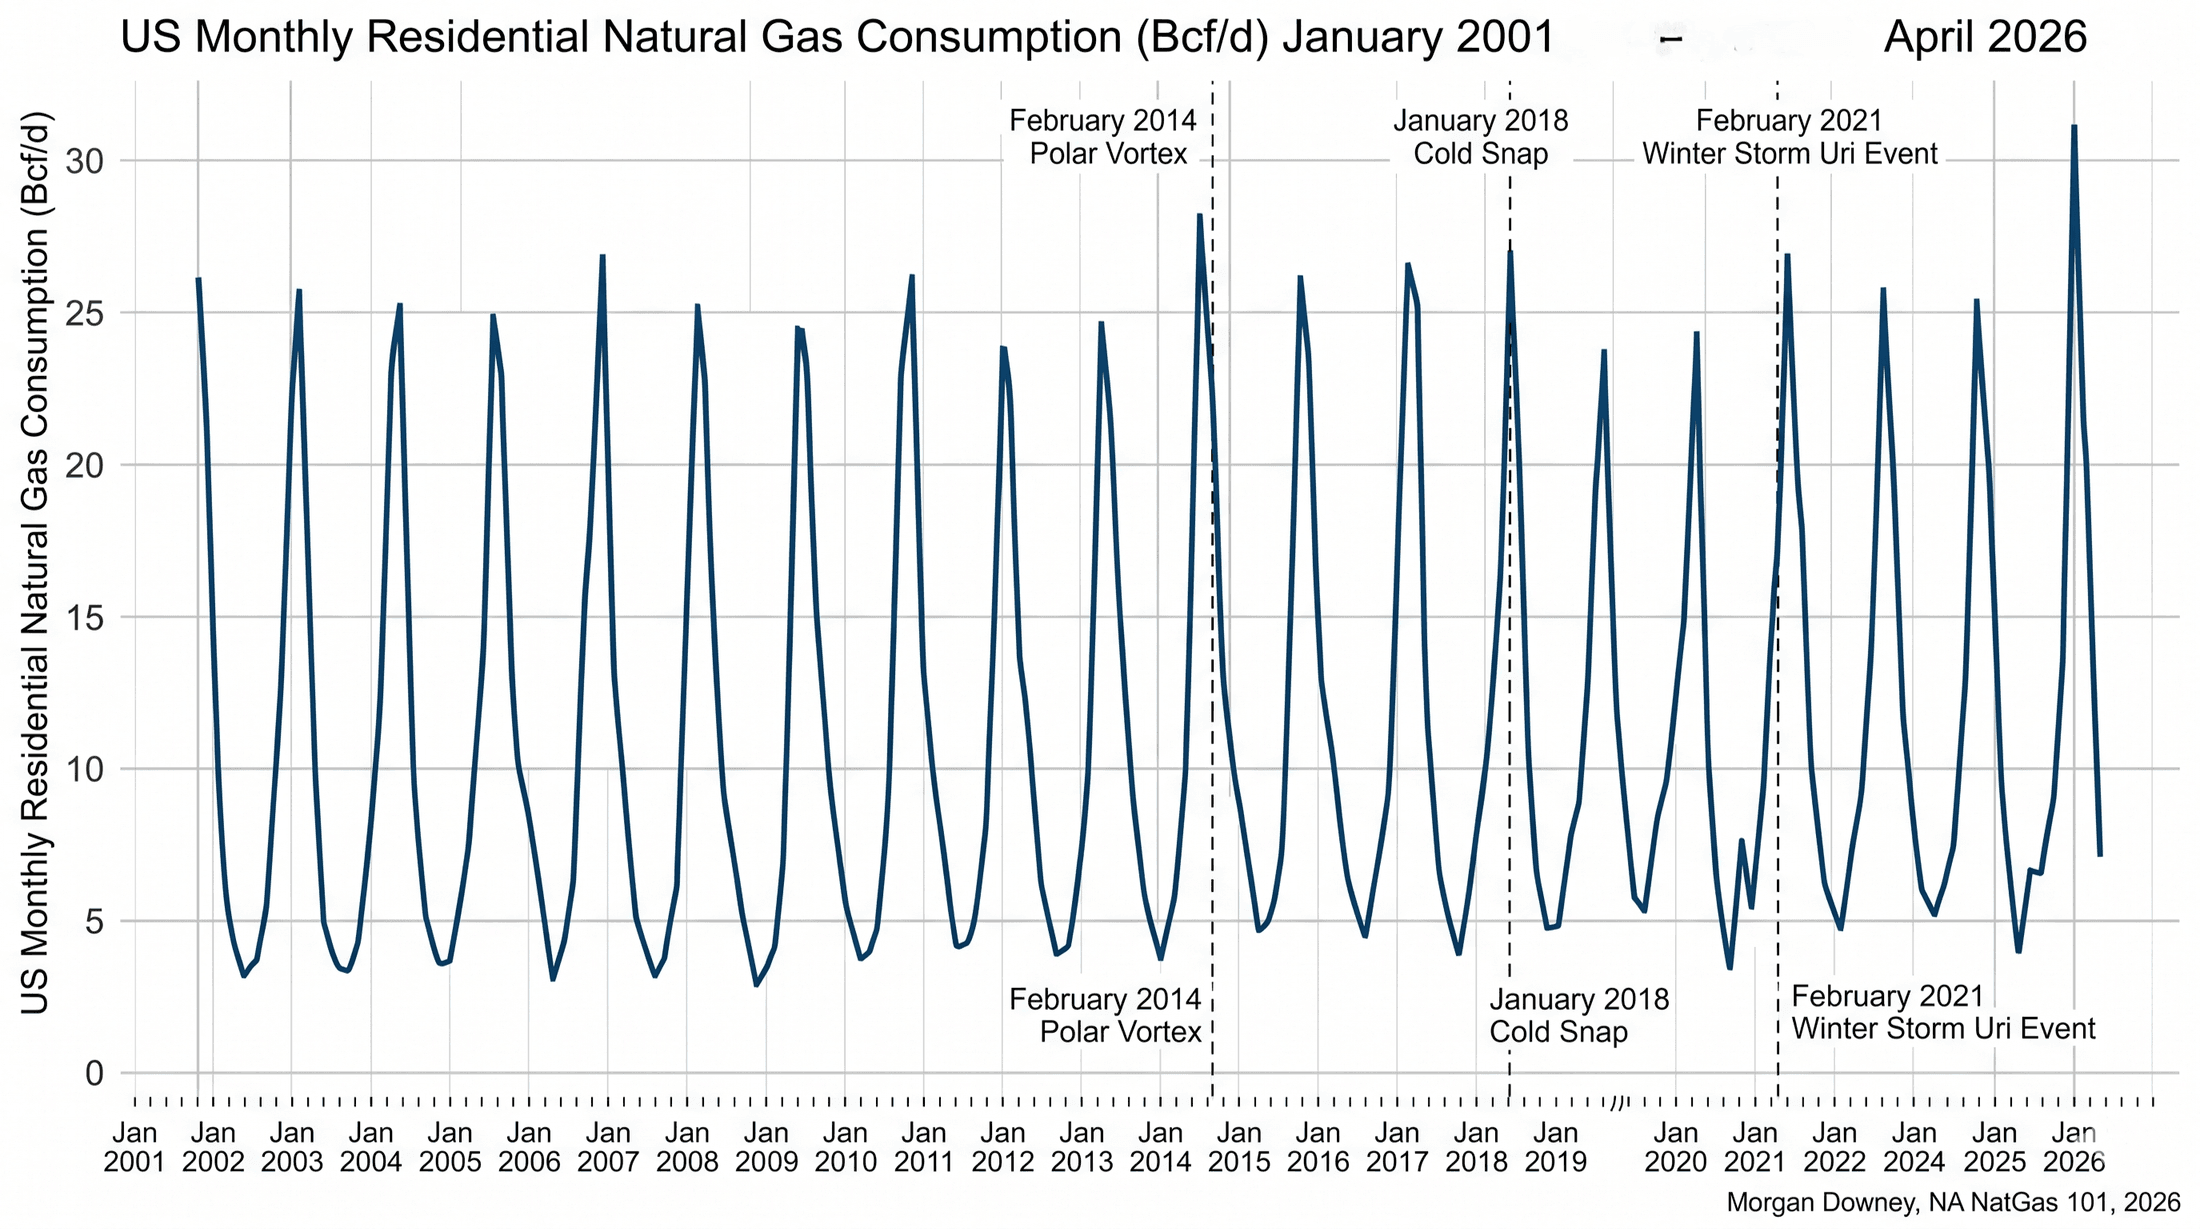
Total US natural gas consumption averaged roughly 90 Bcf/d in 2024 across the demand stack. The sectoral split is built up from the EIA Natural Gas Monthly’s end-use accounts. Power generation was the largest, at roughly 30 Bcf/d, the subject of Chapter 12. Industrial demand was the second-largest, at roughly 23 Bcf/d, including chemical-sector feedstock, fertilizer-sector feedstock, refinery own-use and hydrogen production, and the broader process-heat fleet across food, paper, glass, steel, cement, and aluminum. Residential demand averaged roughly 13 Bcf/d on an annual basis but with a seasonal swing from under 5 Bcf/d in summer to over 30 Bcf/d on the coldest winter mornings. Commercial demand averaged roughly 9 Bcf/d, dominated by space heating and water heating in office buildings, schools, hospitals, restaurants, hotels, and small institutional buildings. Lease and plant fuel, the gas burned by the gas industry itself in field gathering compression and gas plant cryogenic recovery, ran roughly 5 Bcf/d. Pipeline and distribution use, the compressor station fuel covered in Chapter 10 and the small distribution-system shrinkage, ran roughly 1 Bcf/d. LNG export feedgas of roughly 14 Bcf/d in 2024 is a separate category covered in Chapter 14.
Industrial and residential demand together account for roughly 36 Bcf/d, or about 40 percent of US consumption. Power generation is the larger single block, but the structural argument is that industrial demand sets the price floor on a hot summer day with renewables abundant and the residential furnace fleet idle, while residential demand sets the price ceiling on a cold January morning when every Northeast LDC city gate calls for delivery at firm-tariff maximum. The shape of the demand stack determines what the production system must serve, and the relative price elasticity of the two blocks determines how the system clears.
Petrochemical Feedstock and Steam Cracking
The largest single industrial use of natural gas liquids is steam cracking to produce ethylene and propylene, the two largest-volume petrochemical building blocks. The feedstock is ethane, propane, and butanes recovered at gas plants in the Permian, the Marcellus, the Eagle Ford, the Anadarko, and the Bakken, fractionated at Mont Belvieu and Conway as covered in Chapter 9, and shipped by pipeline to the Gulf Coast cracker complex.
A steam cracker is a tubular pyrolysis furnace. Ethane, mixed with steam in roughly equal mass proportions, enters a coil of high-alloy steel tubing inside a fired box and is heated to 1,500 to 1,650 degrees Fahrenheit in less than half a second of residence time. The thermal energy breaks the ethane molecule into ethylene plus hydrogen, with smaller fractions of methane, propylene, butadiene, and a heavier pyrolysis-gasoline byproduct stream. The cracked gas is quenched immediately on exit to halt secondary reactions, then routed through a compression train, an acid-gas removal unit, a drying unit, and a cryogenic separation train that delivers polymer-grade ethylene at over 99.9 percent purity to the downstream polymer plant or the merchant ethylene pipeline. Naphtha cracking, the dominant feed slate at non-US sites, runs at slightly lower coil temperatures and produces a more diverse product slate weighted toward propylene, butadiene, and aromatics. The structural advantage of US ethane cracking is the higher ethylene yield and the lower per-pound feedstock cost.
Roughly 90 percent of US ethylene goes to polyethylene, the largest plastic by volume, in low-density (LDPE), linear low-density (LLDPE), and high-density (HDPE) grades. The remainder is converted to ethylene oxide (the precursor to ethylene glycol for polyester fiber and PET bottles, and to surfactants), ethylene dichloride (the precursor to vinyl chloride monomer and PVC), vinyl acetate (the precursor to coatings, adhesives, and EVA copolymers), styrene (via ethylbenzene), and alpha-olefins (for synthetic lubricants and plasticizers). Propylene is converted to polypropylene (the second-largest plastic by volume), to propylene oxide (the precursor to polyurethanes), to acrylonitrile (the precursor to acrylic fibers and ABS plastics), and to acrylic acid.
The Gulf Coast cracker complex stretches from Corpus Christi through Houston to the Lake Charles area in Louisiana, with specific clusters at Channelview, Port Arthur, Beaumont, Lake Charles, and Geismar. New US capacity since 2017 includes ExxonMobil’s Baytown ethane cracker (commissioned 2018, 1.5 million tonnes per year of ethylene), Dow’s Freeport cracker (commissioned 2017, 1.5 million tonnes per year), Chevron Phillips Chemical’s Cedar Bayou cracker (commissioned 2018, 1.5 million tonnes per year), Indorama / Lotte’s Lake Charles cracker (commissioned 2019), Formosa’s Point Comfort cracker, and Shell’s Monaca cracker in Pennsylvania (first product November 2022, 1.6 million tonnes per year of polyethylene from a fully integrated complex on the former Horsehead Industries zinc smelter site, fed by Marcellus and Utica ethane through the dedicated 97-mile Falcon ethane pipeline). Ethane export terminals at Morgan’s Point and Marcus Hook ship the unconverted molecule to crackers in Norway, Sweden, India, China, and the United Kingdom, with Energy Transfer’s Marcus Hook and Enterprise Products Partners’ Morgan’s Point covering the bulk of US ethane export volume.
Beyond ethylene, the second large petrochemical use of natural gas is the methanol production complex. Methanol plants use natural gas as both feedstock and fuel. Methane and steam react over a nickel catalyst at 1,500 to 1,700 degrees Fahrenheit and 200 to 300 psig in a steam-methane reformer to produce synthesis gas (CO and H2), which is then catalytically converted to methanol over a copper-zinc-alumina catalyst at 480 to 570 degrees Fahrenheit and 700 to 1,500 psig. US methanol production has grown from roughly 2 million tonnes per year in 2010 to over 8 million tonnes per year in 2024. Major plants include the Methanex Geismar complex in Louisiana (the relocated former Chilean unit), the OCI / Natgasoline Beaumont plant, the Yuhuang Chemical St. James plant in Louisiana, and the Koch Methanol St. James plant. Methanol is converted downstream to formaldehyde, acetic acid, methyl methacrylate, MTBE, and (increasingly) to olefins through methanol-to-olefins technology in markets where direct steam cracking is uneconomic. Total petrochemical gas demand (feedstock plus on-site fuel for the cracker furnaces, the SMR units, and the steam systems) is roughly 8 to 10 Bcf/d in 2024.
Ammonia, Fertilizer, and the Haber-Bosch Process
Atmospheric nitrogen is inert at ambient conditions. The triple bond of the N2 molecule is one of the strongest bonds in chemistry, and breaking it requires extreme conditions and the right catalyst. Fritz Haber demonstrated the synthesis of ammonia from atmospheric nitrogen and hydrogen in 1909 at the Karlsruhe Technische Hochschule. Carl Bosch and BASF scaled the chemistry to industrial production at the Oppau plant in 1913. The Haber-Bosch process now produces roughly 180 million tonnes per year of ammonia globally and is the foundation of the global food system: roughly half of the world’s population is fed by crops grown with synthetic nitrogen fertilizer, and roughly 80 percent of that synthetic nitrogen begins as Haber-Bosch ammonia. Ammonia synthesis itself is estimated to consume roughly 1 to 2 percent of global energy use.
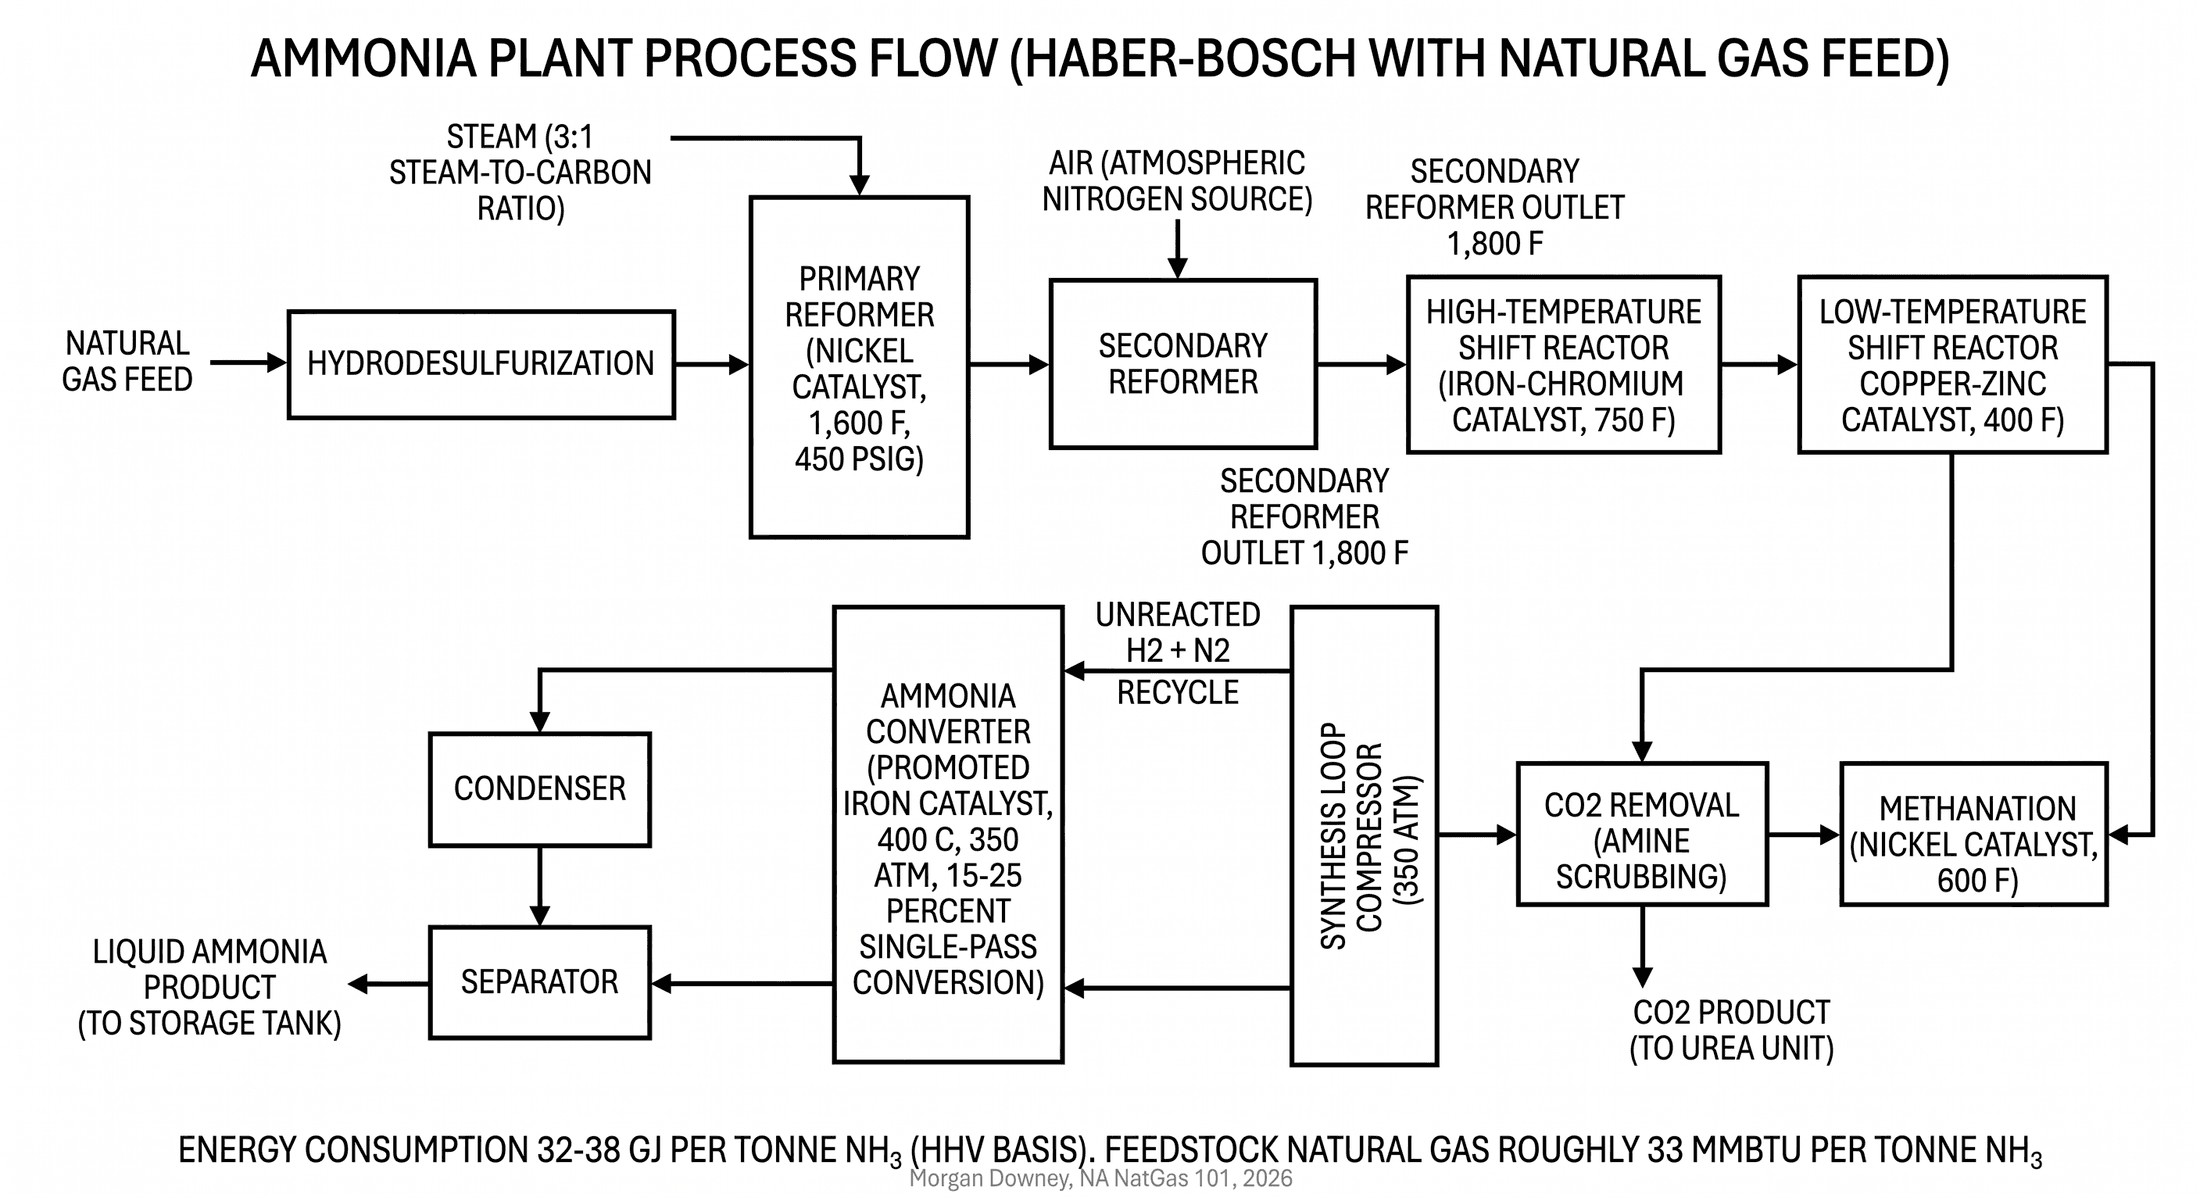
The chemistry runs in two stages, both fed by natural gas. Hydrogen is produced first by steam-methane reforming. Methane and steam react over a nickel catalyst at 1,500 to 1,700 degrees Fahrenheit and 350 to 500 psig in a fired tubular reformer, producing synthesis gas of approximately 3 parts hydrogen to 1 part carbon monoxide. The synthesis gas passes through a high-temperature water-gas shift reactor over an iron-chromium catalyst, then a low-temperature shift reactor over a copper-zinc catalyst, where the carbon monoxide reacts with additional steam to produce CO2 and more hydrogen. The CO2 is removed by amine scrubbing or pressure-swing adsorption. The cleaned hydrogen stream is mixed with atmospheric nitrogen (separated cryogenically from air or recovered from a partial-oxidation step) in a 3-to-1 stoichiometric ratio.
The mixed gas enters the synthesis loop. Modern Haber-Bosch synthesis runs at 200 to 400 atmospheres pressure and 400 to 500 degrees Celsius over a promoted iron catalyst. The single-pass conversion is only 15 to 25 percent, so the reactor effluent is cooled, the ammonia is condensed out as a liquid, and the unreacted hydrogen and nitrogen are recompressed and recycled to the inlet. The chemistry is exothermic, and the heat released by the reaction provides much of the steam load for the upstream reforming and shift sections. The process is energy-intensive: roughly 32 to 38 gigajoules per tonne of ammonia for a modern natural-gas-based plant, of which the great majority is the chemical energy of the methane feedstock that ends up as hydrogen in the ammonia molecule.
US ammonia production capacity is roughly 16 million tonnes per year, primarily on the Gulf Coast and in the Corn Belt. CF Industries operates the largest single complex in the world at Donaldsonville, Louisiana, on the west bank of the Mississippi River, with five ammonia trains and four urea trains and roughly 4 million tonnes per year of ammonia capacity, consuming roughly 250 MMcf/d of natural gas as feedstock and process fuel. CF also operates major plants at Port Neal, Iowa; Verdigris, Oklahoma; Yazoo City, Mississippi; Woodward, Oklahoma; and Courtright, Ontario. Nutrien (the 2018 merger of Agrium and PotashCorp) operates plants at Borger, Texas; Geismar, Louisiana; Kenai, Alaska; and Carseland, Alberta. Koch Fertilizer operates plants at Enid, Oklahoma; Beatrice, Nebraska; and Dodge City, Kansas. OCI Beaumont operates the Beaumont, Texas methanol-and-ammonia complex and the Wever, Iowa Iowa Fertilizer Company plant. LSB Industries operates the El Dorado, Arkansas plant. Yara operates the Belle Plaine, Saskatchewan plant and US distribution.
Ammonia is converted downstream to urea (by reaction with CO2 from the SMR step, the simplest way to upgrade the gas-derived nitrogen into a solid, easily handled fertilizer), to ammonium nitrate (by reaction with nitric acid, primarily for industrial and explosives use after the post-Oklahoma City regulatory tightening of agricultural ammonium nitrate), to UAN solutions (urea-ammonium nitrate liquid fertilizer, the dominant form of nitrogen applied in row-crop agriculture), and to ammonium sulfate and diammonium phosphate (in the multi-nutrient fertilizer chain). Anhydrous ammonia itself is also applied directly to soil through specialized injection equipment, particularly in the Corn Belt where the infrastructure for transport, storage, and field application is well-developed. Total US fertilizer-sector gas demand is roughly 2 to 3 Bcf/d.
Other Industrial Process Heat
The non-petrochemical, non-fertilizer industrial gas load is built up from a long list of process-heat applications, each with its own temperature, atmosphere, and continuity requirements. Glass melting requires 2,700 to 3,000 degrees Fahrenheit and a continuous high-purity flame; container glass furnaces (Owens-Illinois, Ardagh, Anchor Hocking) and flat glass furnaces (Pilkington, Vitro, Guardian) operate continuously for furnace campaigns of 8 to 12 years between rebuilds, with a hot idle that costs gas but cannot be interrupted without destroying the refractory lining. Cement clinker burning requires 2,700 degrees Fahrenheit at the kiln tip; the US cement fleet is in the middle of a multi-decade transition from coal and petroleum coke to natural gas as the dominant kiln fuel, accelerated by tightening EPA mercury and air toxics rules and by the cost-per-MMBtu collapse of post-2010 gas. Direct-reduced iron (DRI) production, the modern alternative to blast-furnace iron-making, uses natural gas as both reductant and process heat at 1,500 to 1,800 degrees Fahrenheit; Nucor, Cleveland-Cliffs, and Steel Dynamics operate DRI plants in Louisiana, Texas, and Indiana that consume hundreds of MMcf/d of gas in steady-state operation.
Refining is a substantial industrial gas consumer in two distinct accounts. Refinery own-use gas runs the process furnaces (atmospheric and vacuum distillation, catalytic reforming, hydrocracking, hydrotreating, alkylation) and the steam system. Refinery hydrogen production for hydrocracking and hydrotreating runs through dedicated steam-methane reformers identical in chemistry to the front end of an ammonia plant. Total US refining-sector gas demand is roughly 1.5 to 2 Bcf/d.
Food and beverage processing is the largest of the captive (low-elasticity) industrial blocks. Steam pasteurization at 200 to 300 degrees Fahrenheit, baking and roasting ovens at 400 to 700 degrees, dehydration, sterilization, and clean-in-place hot water systems all run on gas-fired boilers and direct-fired equipment. Tyson, JBS, Cargill, ConAgra, General Mills, Kraft Heinz, Anheuser-Busch InBev, and the Coca-Cola and PepsiCo bottling networks operate hundreds of plants across the country, each with steady year-round gas consumption that is essentially uncorrelated with the Henry Hub price in the short run because the cost of switching fuel mid-process is higher than any plausible commodity savings.
Pulp and paper, with its recovery boilers and paper machine drying sections, consumes roughly 0.5 to 1 Bcf/d. Aluminum rolling mills, with their reheat furnaces and homogenization furnaces, consume on the order of 0.1 Bcf/d. Brick, ceramics, gypsum board, and lime kilns add the long tail.
The defining feature of industrial gas demand is the bimodal price elasticity. The price-exposed segments (chemicals, fertilizer, pulp and paper) curtail production within days when the gas-priced cost of feedstock rises above the export-priced revenue of finished product. CF Industries and OCI publish quarterly capacity-utilization figures that move with the Henry Hub-to-urea-export-netback ratio. The captive segments (food, beverage, brick, ceramics) do not curtail because their gas cost is a small fraction of total operating cost and their finished product is geographically captive to the local market. The price elasticity defines the demand response when Henry Hub spikes: a chemical plant can curtail production within days; a residential furnace cannot.
Residential Heating and the Heating Degree Day
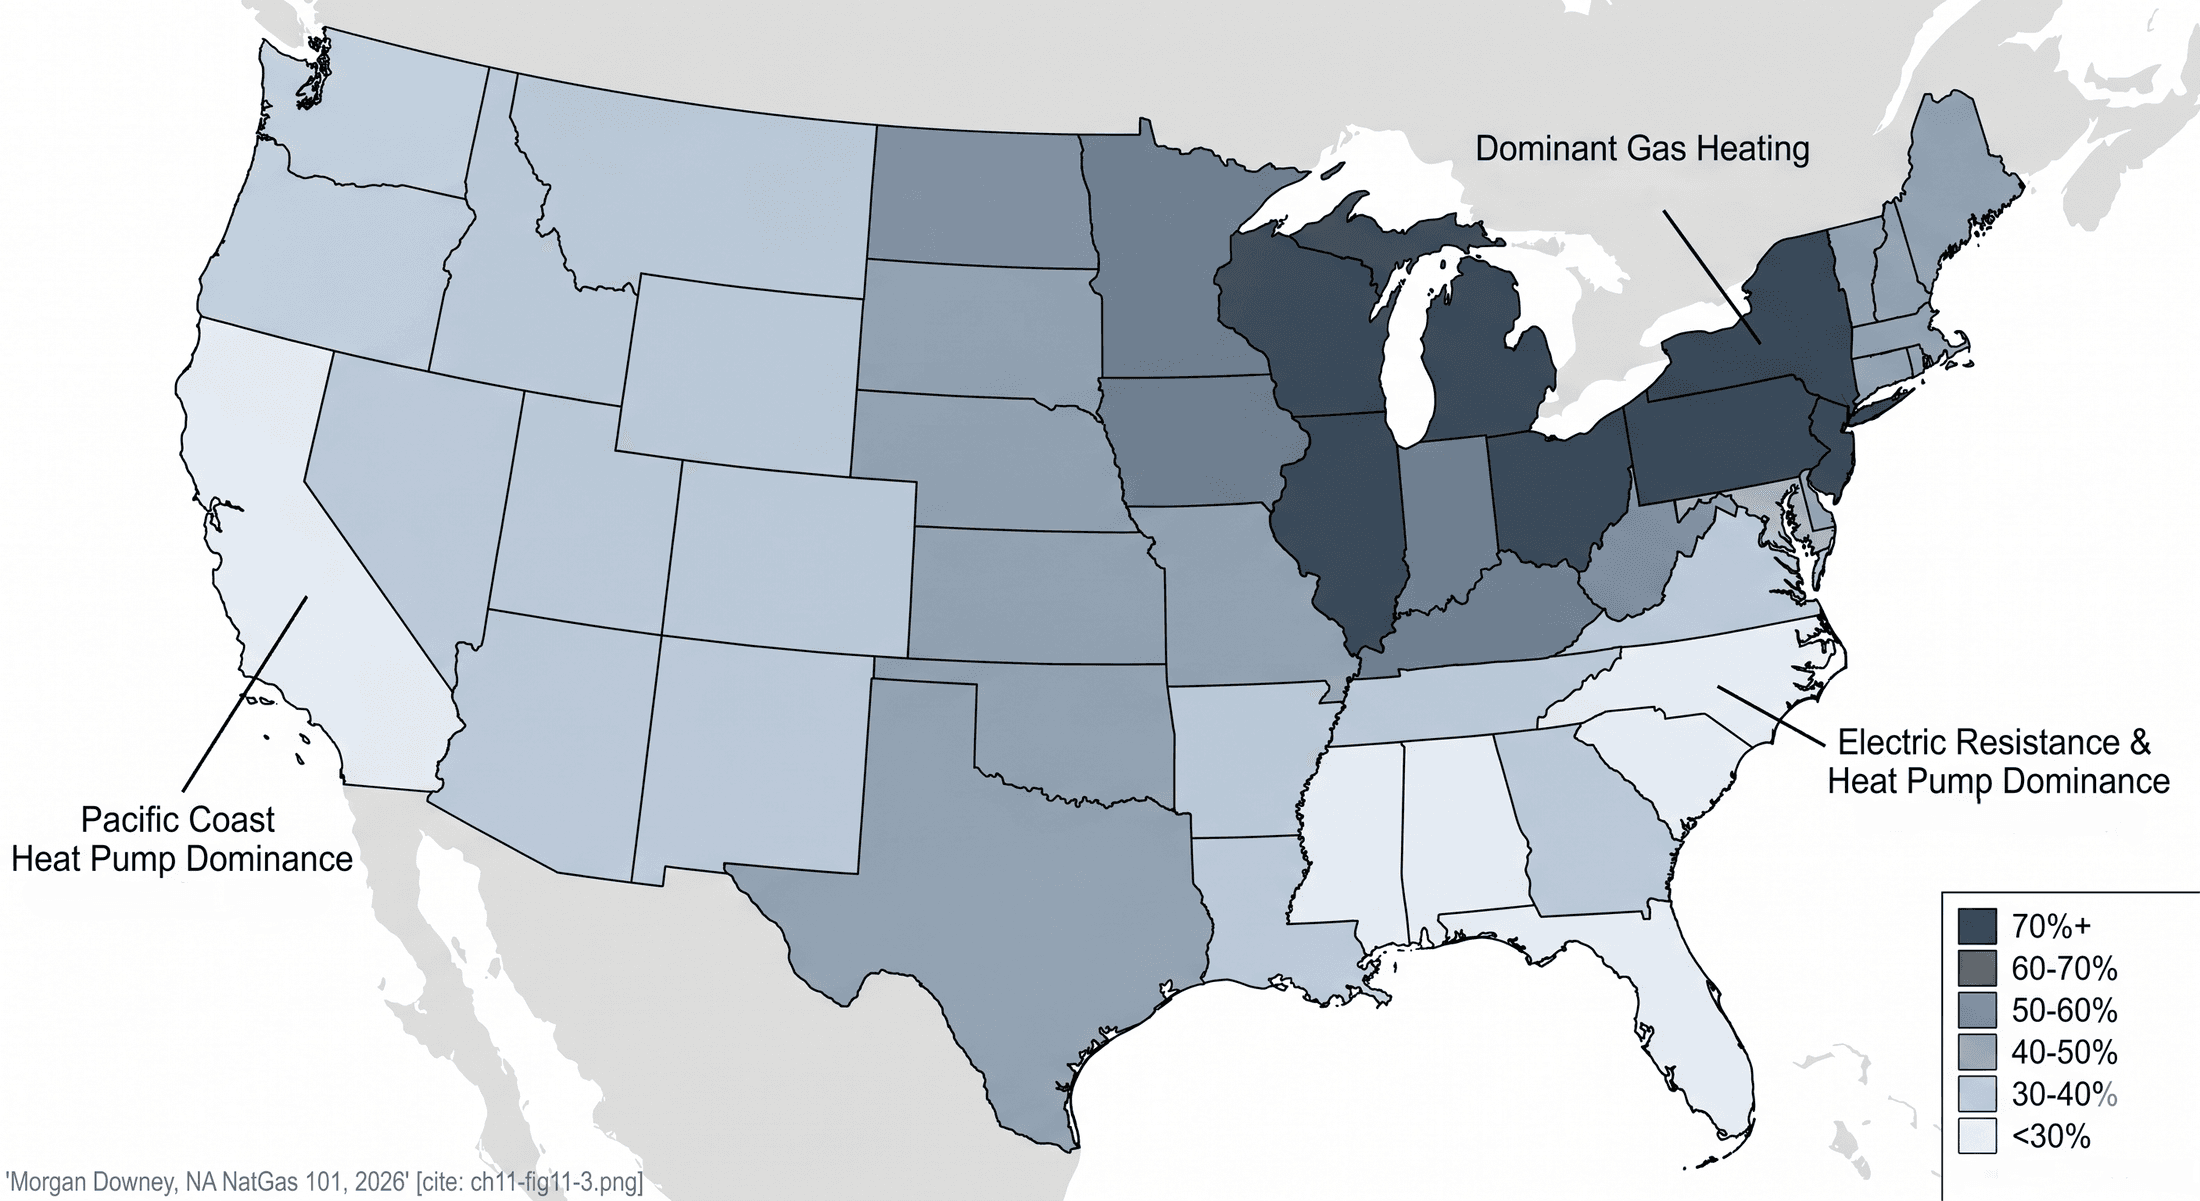
Roughly 60 to 65 percent of US households use natural gas for primary space heating, with the share higher in the Northeast, Midwest, and Mountain West, and lower in the Southeast and the Pacific Coast where electric heat pumps and resistance heating dominate. Roughly 70 million US households are connected to a gas utility distribution system, with the connection density highest in the urbanized Northeast and Midwest and lowest in the rural South. Residential gas demand is driven primarily by space heating, secondarily by water heating (gas-fired tankless and storage water heaters), and tertiarily by cooking (gas ranges and ovens) and clothes drying (gas dryers). Space heating dominates the seasonal swing.
The heating degree day, HDD, is the standard measurement of heating-driven gas demand. HDDs for a given day are computed as 65 degrees Fahrenheit minus the average temperature for the day, where the average is the simple mean of the daily high and low. A 30-degree day produces 35 HDDs; a 0-degree day produces 65 HDDs; a day with an average of 65 or higher produces zero HDDs. The 65-degree base is the US standard, derived from mid-twentieth-century building thermal performance studies that found a typical American house required no supplemental heat at outdoor average temperatures above 65. NOAA’s National Centers for Environmental Information publishes daily HDD aggregates by state, by census region, and on a national population-weighted basis. The population-weighted national aggregate is the relevant figure for residential gas demand, because it weights the cold cities where most gas-heated households live more heavily than the warm states where they do not.
National accumulated HDDs for a heating season (typically October through March) range from roughly 4,000 in mild winters to over 5,000 in cold winters, against a 30-year normal in the mid-4,000s. Each Bcf/d of incremental residential gas demand corresponds to roughly 1 to 2 HDDs of incremental coldness on a national average basis, with the slope steeper in the Northeast and shallower in the South. Trader screens during heating season carry the NOAA day-ahead HDD forecast as a leading indicator. A 50-HDD revision in the forecast is roughly the same news as a 25-Bcf revision in the EIA storage report.
The peak-day demand pattern is sharp. Residential gas demand swings from roughly 5 Bcf/d in summer (cooking, water heating, dryers) to over 30 Bcf/d on the coldest winter mornings, with the swing concentrated in the 6-to-10 AM and 5-to-9 PM windows of cold weekdays as households wake up and return home. The morning peak is the binding constraint for the LDC distribution system. A typical Northeast LDC sees its city-gate sendout climb from a 2 AM minimum to a 7 to 9 AM maximum that is two to three times higher, on a weekday in single-digit Fahrenheit weather. The afternoon trough is shallower than the overnight trough because solar gain reduces but does not eliminate the heating load on a sunny winter afternoon. The evening peak is smaller than the morning peak because households are by then thermally re-equilibrated and the building envelopes have warmed through the day.
The LDC distribution system is sized for the peak hour of the peak day. The annual utilization factor of a typical Northeast LDC system is roughly 25 to 40 percent of installed delivery capacity, meaning the system runs well below capacity for most of the year and is fully loaded only for a few hours a few days a year. The fixed-cost recovery problem this creates, charging customers the full cost of a system that sits idle 65 to 75 percent of the time, is one of the central challenges of LDC rate design and one of the structural arguments against the slow-electrification transition the industry now faces.
The LDC Utility Model and Rate Regulation
Local distribution companies deliver gas from interstate pipeline city gates to residential, commercial, and small industrial end-users through low-pressure distribution networks, typically operating at 60 psig at the city gate and stepped down through district regulators to 0.25 psig at the customer’s meter. The gas in the distribution main is the same gas that left the wellhead two weeks earlier: there is no transformation between pipeline and meter, only progressive pressure reduction and commercial reallocation. The LDC’s physical plant is the network of distribution mains (cast iron, ductile iron, bare steel, coated steel, and polyethylene, in declining order of vintage), services (the lateral pipes from the main to each building), meters, regulators, and the SCADA and telemetry systems that monitor pressure and flow.
Major US LDC operators include National Grid (downstate New York, Massachusetts, Rhode Island), Consolidated Edison and its KeySpan subsidiary (New York City and Westchester), PG&E (northern California), Sempra subsidiaries SoCalGas (Southern California) and SDG&E (San Diego), NiSource subsidiary Columbia Gas (Ohio, Pennsylvania, Indiana, Kentucky, Maryland, Virginia, and Massachusetts), Atmos Energy (Texas, Louisiana, Mississippi, Tennessee, Kentucky, Colorado, Kansas, and Virginia), Southern Company Gas (Georgia, Tennessee, Virginia, New Jersey, and Illinois, the former AGL Resources / Nicor combination), Spire (Missouri and Alabama), CenterPoint Energy (Texas, Louisiana, Mississippi, Arkansas, Oklahoma, Minnesota, and Indiana), Consumers Energy and DTE Energy (Michigan), and Xcel Energy (Minnesota, Colorado, Wisconsin, North and South Dakota, and Texas). The map has been M&A-active since 2010.
The LDC model is regulated at the state public utility commission level. Each LDC files a rate case every two to four years that establishes its allowed return on equity (typically 9 to 11 percent on a forward-looking basis as approved by the state commission), its rate base (the depreciated value of distribution mains, services, meters, and regulator stations on the company’s books, with a capital structure assumption of roughly 50 percent equity and 50 percent debt), its cost-of-service tariffs by customer class (residential, small commercial, large commercial, firm industrial, interruptible industrial), and its purchased gas adjustment mechanism. The PGA passes commodity gas price changes through to customers without affecting the LDC’s own margin: the LDC buys gas on behalf of its sales-service customers at wholesale prices, and resells the gas at the wholesale price plus a tariffed delivery charge.
The cost-recovery architecture insulates the LDC from commodity price risk. The LDC’s profit comes from the depreciation and return on the distribution rate base, not from the commodity gas itself. The 2008 spike to $13 Henry Hub did not affect any US LDC’s earnings; the 2012 collapse to under $2 did not affect them either. The earnings driver is rate-base growth, which is driven by capital investment in distribution main replacement, service line replacement, meter modernization (the multi-decade rollout of automated meter reading and advanced metering infrastructure), and the major safety-driven cast-iron and bare-steel main replacement programs that most state commissions have approved on accelerated cost recovery through tracker mechanisms.
The interruptible-industrial customer class is the residual flexibility in the LDC tariff stack. An interruptible customer pays a lower delivery charge in exchange for the LDC’s right to curtail service on peak-demand days. On a polar vortex morning when the LDC is calling its city-gate firm-tariff maximum and residential heat is approaching its peak, interruptible industrial customers receive notice to curtail. The interruptible customer either switches to an alternate fuel (most commonly fuel oil, retained for backup despite its environmental and storage costs precisely for these days), runs at reduced rates, or shuts down for the duration. The LDC is contractually obligated to deliver gas to its residential and small-commercial firm customers; it is not obligated to deliver gas to its interruptible industrial customers. The hierarchy of curtailment is the contractual expression of the regulatory premise that residential heat is essential service in a way industrial process gas is not.
Building Electrification Policy and Appliance Lock-in
Several states and municipalities have moved to restrict new gas appliance installation as a greenhouse gas policy. New York State’s 2023 All-Electric Buildings Act, enacted as part of the FY 2024 Enacted Budget through Senate Bill S4006-C and Assembly Bill A3006-C, prohibits the installation of fossil-fuel combustion equipment in most new buildings under seven stories starting in 2026 and in all new buildings starting in 2029, with industrial, manufacturing, hospital, and emergency-power exemptions. The Act is the first state-level prohibition of gas service to new construction in the United States. Massachusetts authorized a 10-municipality demonstration program for all-electric building codes through its 2022 climate legislation. Washington State updated its building energy code in 2023 to set a default expectation of all-electric heating in new construction, with prescriptive paths and compliance alternatives.
Berkeley, California passed the first municipal-level gas hookup ban in 2019, prohibiting the extension of natural gas piping into new buildings within city limits. The ordinance was challenged by the California Restaurant Association, which argued that the ban was preempted by the federal Energy Policy and Conservation Act because EPCA preempts state and local energy-conservation standards for covered consumer appliances, including gas ranges. The Ninth Circuit Court of Appeals in California Restaurant Association v. City of Berkeley, 89 F.4th 1094 (9th Cir. 2024) (panel decision originally issued April 17, 2023, with rehearing en banc denied January 2, 2024), held that the Berkeley ordinance was preempted by EPCA and vacated the ordinance. The decision casts a significant shadow over municipal-level hookup bans across the country, although the New York State all-electric act, framed as a building code rather than an appliance standard, is structured to avoid the same EPCA challenge.
The Inflation Reduction Act of 2022 provided substantial federal tax credits for heat pump installation. Section 25C of the Internal Revenue Code, as amended by the IRA, allows households up to $2,000 per year in tax credits for the installation of qualifying air-source heat pumps and heat pump water heaters. Section 25D allows up to 30 percent of installation costs (with no annual cap, subject to total project limits) for ground-source heat pumps. The High-Efficiency Electric Home Rebate Program, separately funded under the IRA, provides up to $8,000 in point-of-sale rebates for qualifying low- and moderate-income households installing heat pumps. Massachusetts, California, New York, and Washington State have launched complementary state-level pilot programs for “non-pipeline alternatives,” in which the LDC subsidizes all-electric retrofits in lieu of replacing aging gas distribution mains.
The market-structure point is appliance lock-in. A typical US gas furnace lasts 18 to 25 years; a gas boiler 25 to 35 years; a gas water heater 8 to 12 years; a gas range 15 to 20 years; a gas clothes dryer 13 to 15 years. The average age of the US installed base is roughly 11 to 15 years depending on the appliance category. Replacing the existing installed base on natural turnover takes 20 to 30 years from the date a hookup ban takes effect, even with aggressive incentives, and the gas distribution infrastructure must continue to serve the existing customer base through that period. The policy debate is not whether the building stock will eventually electrify in some markets; it is what the rate base and the commodity demand profile look like in 2035 and 2045, and which LDCs serve a shrinking customer count over that period.
The slow turnover has a financial corollary that has begun to surface in state rate cases. As customer counts decline in jurisdictions with binding electrification policy, the fixed cost of the distribution system must be recovered from a shrinking ratepayer base. The cost per remaining customer rises. The rate increases reinforce the incentive of the next customer to electrify, which further shrinks the base. The dynamic, sometimes called the gas utility death spiral by its proponents and dismissed by its skeptics, is the central financial question facing LDCs in California, Massachusetts, New York, and Washington over the 2030s. The first commission to confront it directly is the California Public Utilities Commission, which opened a long-running proceeding on the future of the gas system in 2020 and has continued the docket through multiple phases.
The 2021 UK CO2 Crisis
In September 2021, CF Industries’ UK subsidiary CF Fertilisers announced it would idle both of its UK ammonia plants, at Billingham in northeast England and at Ince in northwest England, citing wholesale UK natural gas prices that had risen above 200 pence per therm and made urea and ammonium nitrate production uneconomic. The two plants had together produced roughly 60 percent of the UK’s domestic carbon dioxide supply as a byproduct of the ammonia synthesis (the CO2 captured from the SMR step before the synthesis loop, which on a US Gulf Coast plant goes to urea production but on the UK plants was recovered, purified, and sold to the food, beverage, and meat-packing industries).
Within days, UK abattoirs reported they could not stun pigs and poultry; UK breweries reported they could not carbonate beer; UK supermarkets reported their packaged-meat suppliers could not maintain modified-atmosphere packaging; and the National Health Service reported a shortage of medical CO2 used in surgical procedures and frozen-food cold chains. The UK government, on Tue Sept 21, 2021, announced an emergency three-week subsidy to CF Industries to restart the Billingham ammonia plant for the sole purpose of producing the CO2 byproduct, at a reported cost of tens of millions of pounds.
The episode illustrated the chemistry of the gas-ammonia-CO2 chain in the most concrete way: the United Kingdom’s pork supply, beer carbonation, and medical surgery all depended on the byproduct CO2 of two natural-gas-fed ammonia plants. The Ince plant was permanently closed in 2022. The Billingham plant has not produced ammonia commercially since the subsidy expired. The UK’s industrial CO2 supply has since been restructured around imports and other byproduct sources. The 2021 episode is the cleanest single illustration of how deeply the natural-gas-derived ammonia chain runs into the rest of the modern economy, and how poorly the dependence is understood until it breaks.
Industrial and residential demand together set the floor and the ceiling of the US gas market through every season. Chapter 14 covers the third large demand-side block: the LNG export complex that has rebuilt the Gulf Coast since 2016 and that now consumes roughly 14 Bcf/d of feedgas.