A Brief History of Natural Gas
Manufactured gas in 1816, Hart's 1821 well in Fredonia, the first long-distance pipelines, the 1938 Natural Gas Act, Phillips v. Wisconsin and the wellhead price-control era, FERC Order 636, the NYMEX Henry Hub launch, the shale revolution, and the LNG export pivot.
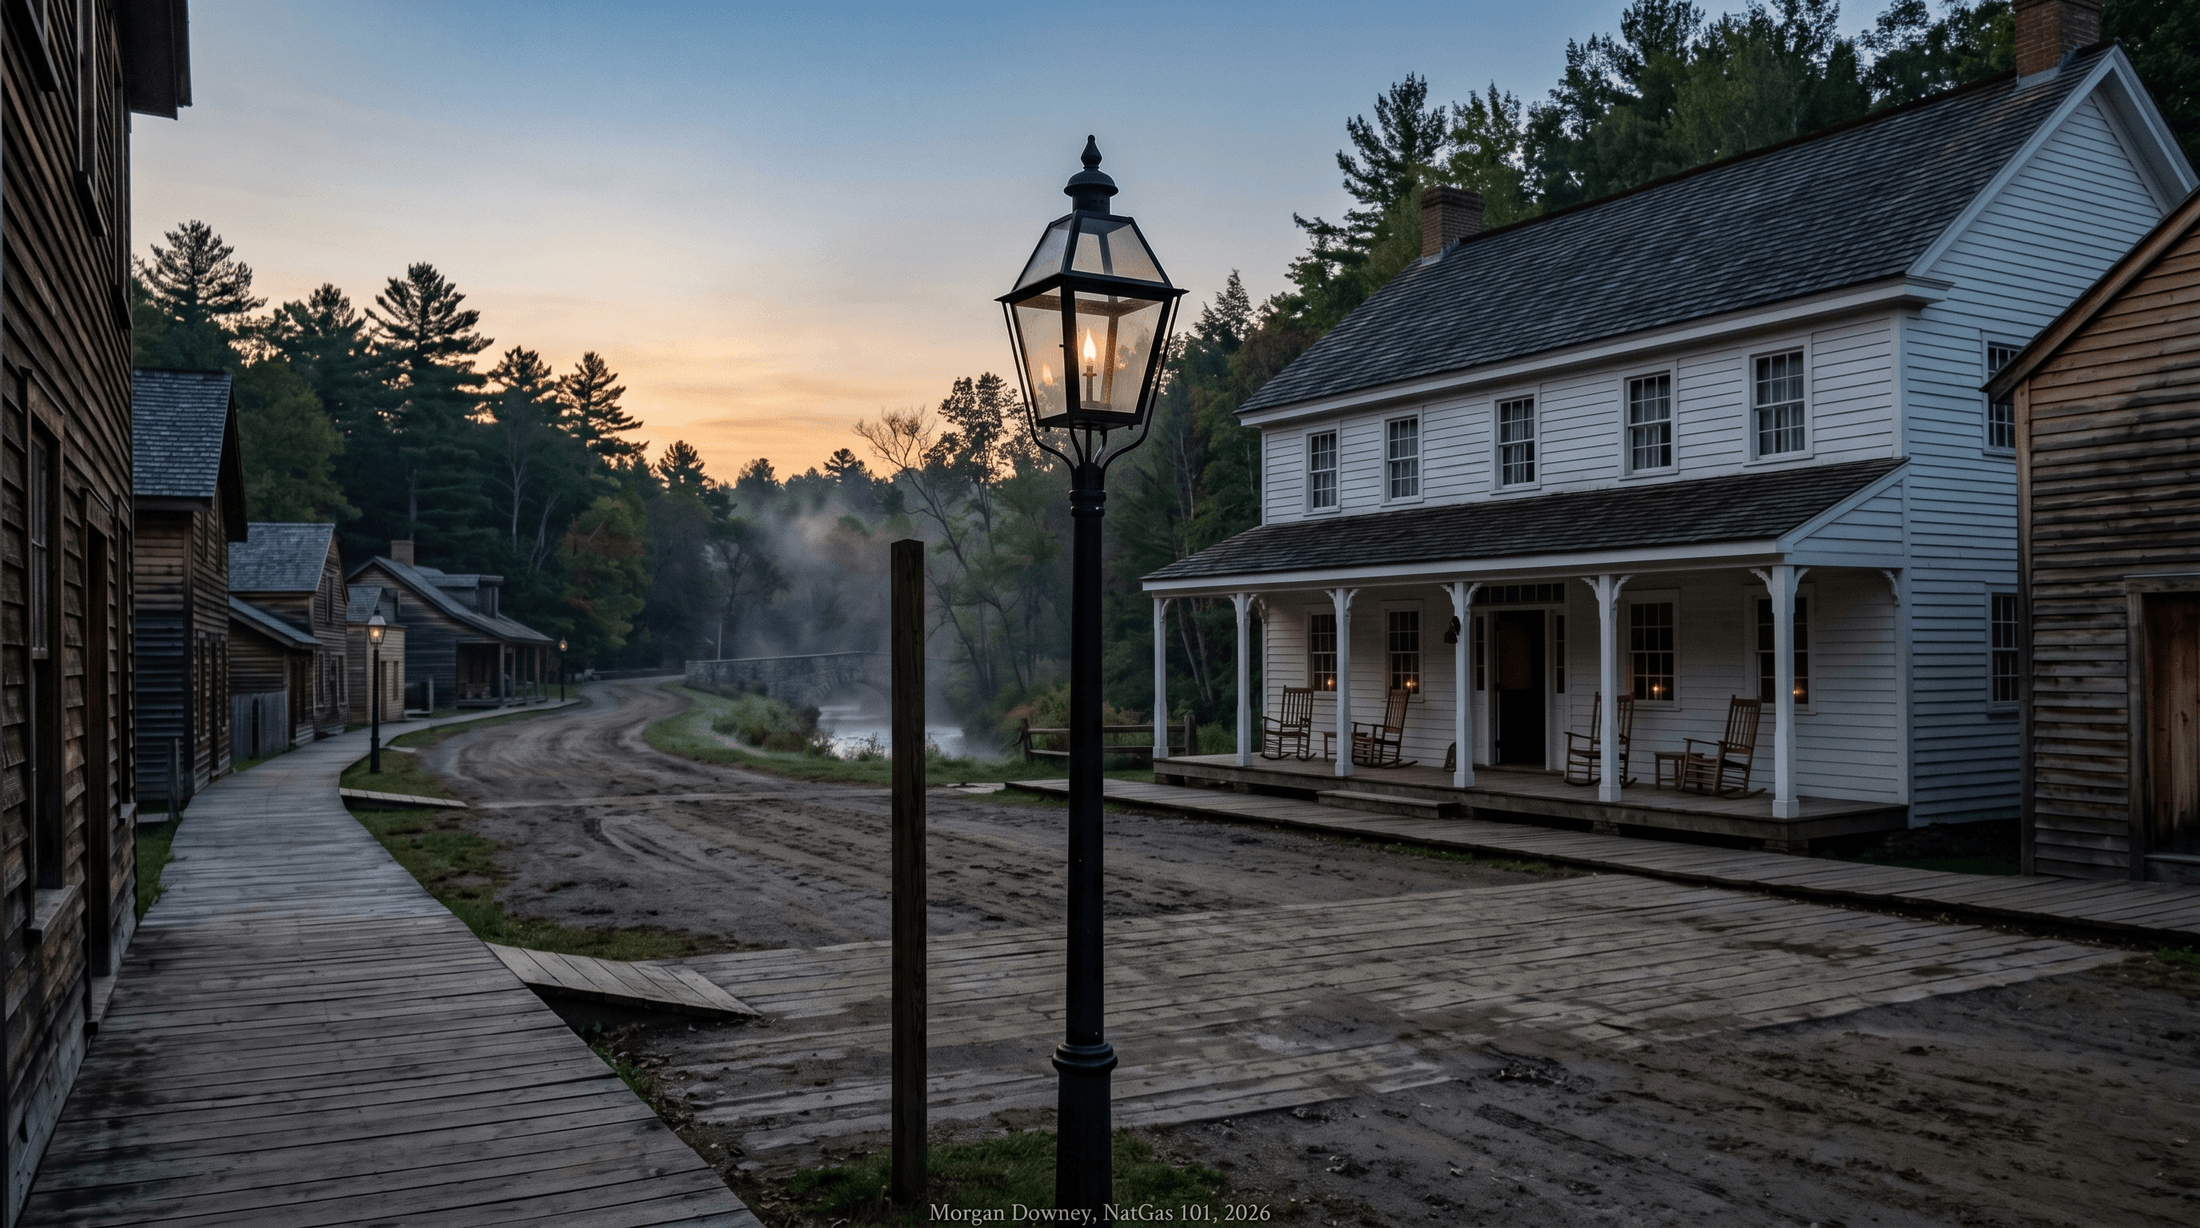
In the summer of 1821, William Aaron Hart, a gunsmith and amateur tinkerer in Fredonia, New York, dug a 27-foot well into a fissure in the bedrock along the south bank of Canadaway Creek where local boys had been amusing themselves by setting bubbles of escaping gas alight on the water. He sealed a wooden barrel over the hole, ran a small pipe through the lid into a length of hollowed-out white pine log fitted into the next, and walked the line up the creek bank to four streetlamps newly installed along Main Street. On the evening that he turned the gas on and lit the lamps, the village inn next door was hosting a banquet for General Lafayette, who was on his American victory tour and had stopped in Fredonia for the night. The Lafayette story is local-tradition; what is documented is that the Fredonia Gas Light Company, the first natural-gas utility in the United States, was incorporated on Hart’s well field in 1858, thirty-seven years after the original four lamps were lit and one year before Edwin Drake drilled the Pennsylvania well that opened the modern oil industry.
Forty years before there was an oil industry, there was already a natural-gas industry. It had four customers and ran on hollow logs. The path from Hart’s lamps to the 14 billion cubic feet per day of US LNG that now sails out of the Gulf of Mexico runs through municipal coal-gas works, two world wars, a Supreme Court ruling that froze exploration for thirty years, a series of FERC orders that broke the pipeline-as-merchant business model, and a small junction in Vermilion Parish, Louisiana, called Henry. This chapter is that path.
The manufactured-gas era, 1816 to 1900
The American gas industry did not begin with natural gas. It began with coal. In June 1816, the Baltimore Gas Light Company was formed, the first municipal gas franchise in the United States, organized by the painter Rembrandt Peale and four investors to light the streets of Baltimore from a small coal-gas works. Peale had visited the Pall Mall gaslit district of London a few years earlier and returned convinced that an American city could be lit the same way. The technology was straightforward in concept and filthy in practice: bituminous coal was heated in sealed cast-iron retorts, the volatile fraction was driven off as gas, and the gas was scrubbed of tar and ammonia, stored in a wet-sealed gasholder, and piped to consumers under modest pressure.
Boston followed in 1822, New York in 1823 with the New York Gas Light Company on lower Manhattan, Philadelphia in 1836, Cincinnati in 1841. By 1859 there were roughly 300 manufactured-gas works operating in the United States, almost all of them in the eastern cities and almost all of them lighting streets, shops, theaters, and the parlors of households wealthy enough to install fixtures and pay the meter rate. Gas cooking and gas heating were not yet the point. The point was light, and the competition was the whale-oil lamp and the candle.
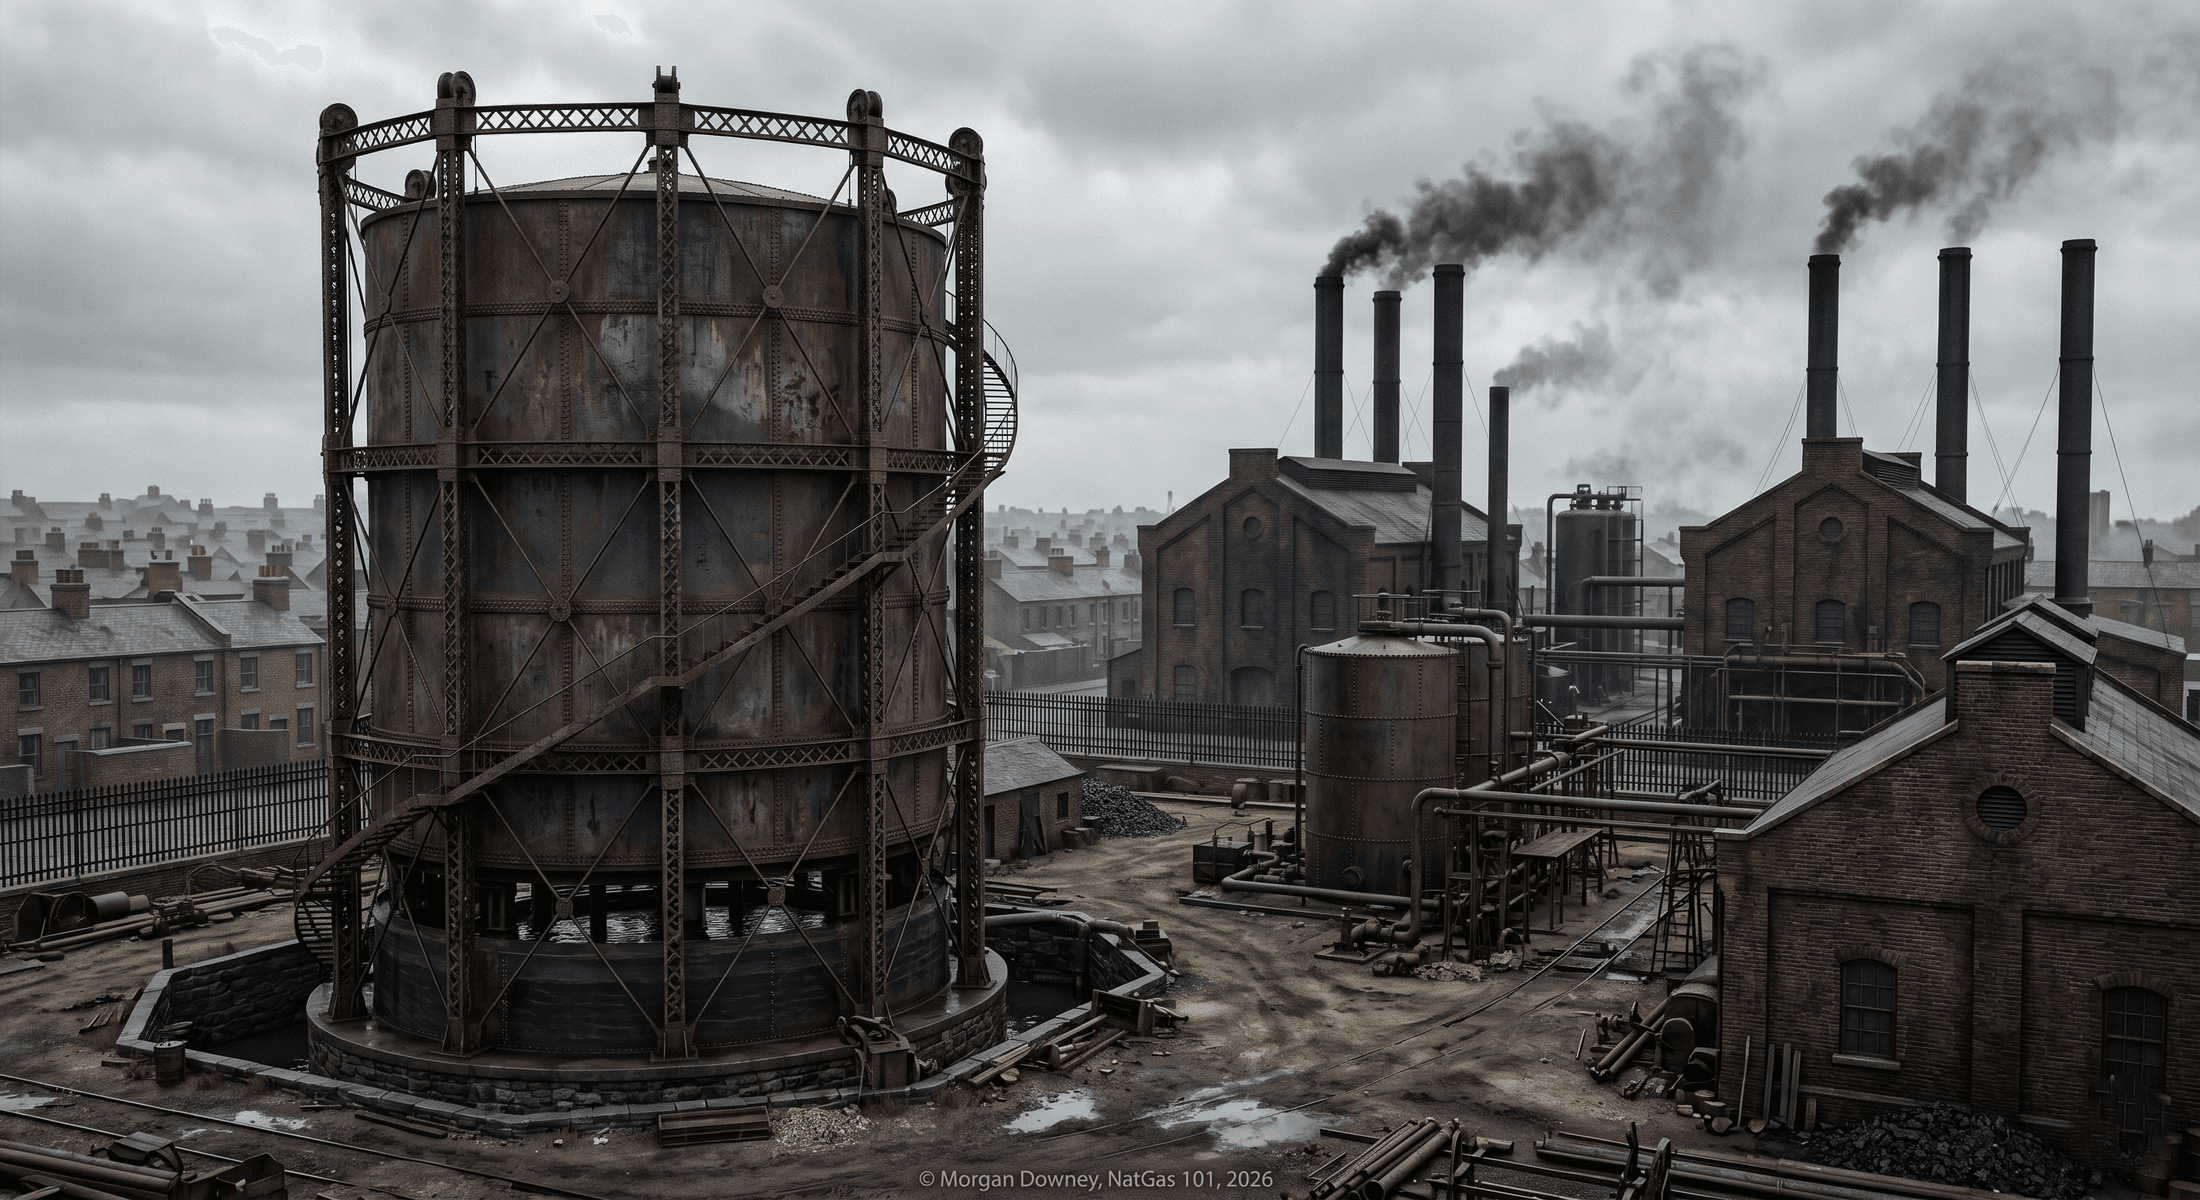
The retorts produced coke as a salable byproduct, sold to ironworks and to households for stove fuel. They produced coal tar, which was originally a disposal problem and which by the late nineteenth century had become the feedstock for the German synthetic-dye industry. They produced ammonia liquor that was sold for fertilizer. The clean gas was the product, and the dirty residuals paid most of the bills. A typical 1880s urban gas works was a fenced industrial site on the edge of downtown, with a row of retort houses, a tar tank, an ammonia condenser, a purifier house full of iron oxide and slaked lime, and one or more telescoping wet-sealed gasholders rising and falling with the daily demand.
What carried into the twentieth century was not the coal-gas chemistry. The chemistry was abandoned by the 1950s, when natural gas pipelines reached most of the US population and the manufactured-gas works were torn down or left as some of the most expensive Superfund sites the EPA would later inherit. What carried over was the distribution layer underneath. The cast-iron mains under the streets of Boston, the lead service lines into the brownstones of Manhattan, the in-house meters and pressure regulators, the franchise contracts with city governments, and the state public utility commissions that emerged in the 1900s and 1910s to regulate the franchise monopolies were all built for a fuel that was made, not extracted. When natural gas finally arrived from Texas and Louisiana, it flowed into a customer base, a network, and a regulatory frame that the coal-gas industry had built over the previous century.
Hart’s 1821 well and early natural gas, 1821 to 1900
The Fredonia line stayed local for the same reason every other early natural gas effort stayed local. There was no way to move the molecule. Wrought-iron pipe with threaded couplings leaked under any meaningful pressure, the joints failed in the seasonal frost-heave cycle, and there was no compressor capable of pushing gas across the kind of distances oil could travel by railcar. The Erie Canal, which opened in 1825 only a few miles north of Fredonia, carried wheat, lumber, salt, and people. It did not carry gas.
For the next sixty years, the natural gas industry advanced one local field at a time, attached to whatever industrial customer happened to sit on top of the seep. The Pennsylvania town of Murrysville, twenty miles east of Pittsburgh, drilled what was probably the first commercial natural-gas well of the modern era on November 3, 1878, when the Haymaker brothers struck a high-pressure gas reservoir while looking for oil and ended up with a thirty-million-cubic-foot-per-day blowout that took months to bring under control.
The Murrysville discovery seeded the Pittsburgh industrial gas boom of the 1880s. By 1885 the Philadelphia Company, organized by George Westinghouse, was piping natural gas into Pittsburgh’s iron and steel mills, replacing the coke and coal previously used in the open-hearth furnaces and the rolling mills. Andrew Carnegie’s mills shifted in part to gas firing in the same window. The Pew family in nearby Bradford was assembling what would become Sun Oil Company on a similar mix of regional crude and casinghead gas. The local gas market in southwestern Pennsylvania in 1885 looked like a recognizable industrial fuel market in microcosm.
It also peaked quickly. The shallow Pennsylvania reservoirs depleted on the same time scale as the Pennsylvania oil discoveries that Drake had launched in 1859. By the early 1900s the Pittsburgh boom had largely run out and the city had reverted partly to coal gas. The technology bottleneck mattered more than the resource. There was gas in the Texas Panhandle, in the Hugoton field of southwest Kansas, in the Appalachian Plateau, and in the Gulf Coast salt domes, but there was no way to move any of it more than a few dozen miles to a customer. The natural-gas industry remained a regional curiosity for the entire nineteenth century.
The first long-distance pipelines, 1925 to 1944
Two technologies broke the bottleneck. The first was the electric-arc welding process, developed for shipyard work during World War One, which made it possible to join steel pipe in long continuous strings without the leak-prone threaded coupling. The second was seamless and high-frequency electric-resistance-welded steel pipe, scaled up in US mills through the 1920s and 1930s and capable of holding several hundred pounds per square inch of internal pressure without rupture. The combination meant a trunk pipeline could now move gas hundreds of miles at line pressures that earlier wrought-iron systems could not approach.
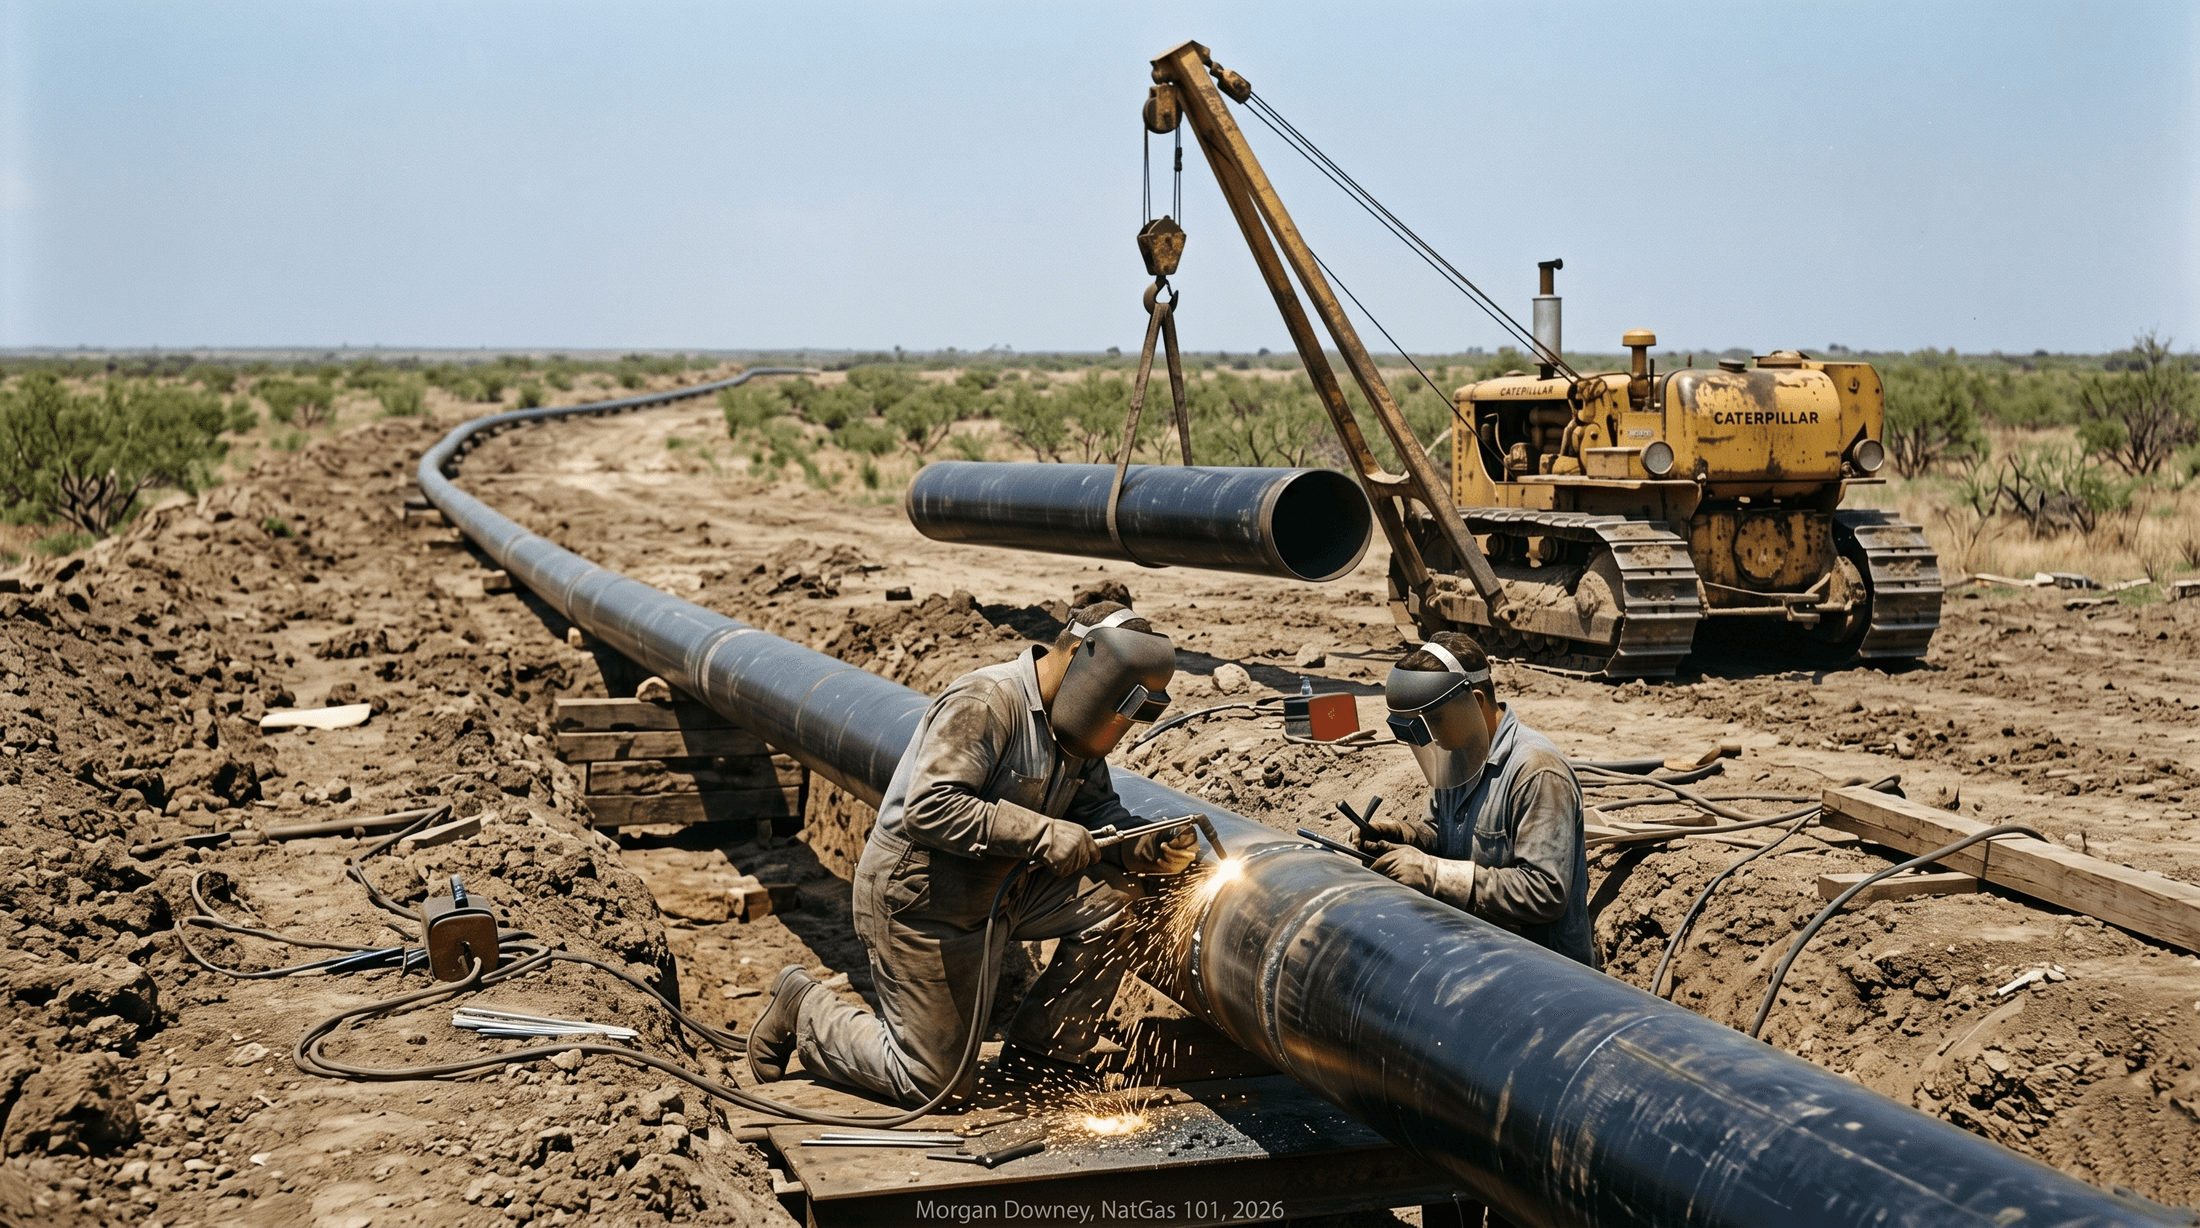
The first generation of long-distance lines went in fast. In 1925 the Magnolia Gas Company began building long-distance lines from the Texas Panhandle into the Gulf Coast. In 1931 Natural Gas Pipeline Company of America completed a 980-mile line from the Hugoton field in southwestern Kansas to Chicago, supplying the Peoples Gas franchise and lighting the Chicago World’s Fair the following year. Through the 1930s, lines reached from the Texas-Louisiana producing belt into Memphis, Atlanta, Detroit, Cleveland, and Cincinnati. The Northeast above New Jersey was still beyond the reach of the trunk grid.
The Second World War closed the gap. German U-boats attacking tanker traffic in the Atlantic shipping lanes in early 1942 cut the Gulf-to-Atlantic seaborne crude oil flow by roughly seventy percent within a few months and threatened to starve the East Coast refining base. The Roosevelt administration’s response was a wartime emergency pipeline project unprecedented in scale: a 24-inch crude line from Longview, Texas, to Phoenixville, Pennsylvania, with an extension to Linden, New Jersey, run by War Emergency Pipelines, Inc., a non-profit corporation set up by a consortium of oil companies under federal contract. Ground was broken on Mon August 3, 1942. The line, called the Big Inch, was 1,254 miles long and was completed in less than thirteen months, delivering its first crude oil to the East Coast in August 1943.
The Little Big Inch, a 20-inch line for refined products on a parallel route, came in March 1944. After the war, both lines sat idle. In 1947, the federal government auctioned them as a single package to a Houston-based newcomer called Texas Eastern Transmission Corporation for $143 million, which immediately announced it would convert both lines to natural gas service. The conversion was completed in 1948. By 1950 the eastern United States had a continental gas grid for the first time in its history. New York City, Philadelphia, and Boston were now connected by pipe to the Texas Panhandle and the Louisiana Gulf Coast. The fuel that had built the gas customer base for a hundred and thirty years on the back of coal was finally being displaced by the molecule that came out of the ground.
The Natural Gas Act of 1938
The new pipelines were natural monopolies. A trunk line from Texas to Chicago took years to build and tens of millions of dollars to finance, and once built it carried the entire interstate gas trade between its endpoints. The economic incentives were immediate and obvious. The Federal Trade Commission’s Utility Corporations Inquiry, a Senate-ordered investigation that ran from 1928 to 1935 and produced ninety-six volumes of reports, documented coordinated rate-setting, holding-company stacking, and self-dealing across the new long-distance gas pipelines and the city distribution franchises that bought from them. The Supreme Court had already held in Missouri ex rel. Barrett v. Kansas Natural Gas, 265 U.S. 298 (1924), that state utility commissions could not regulate the rates at which an interstate pipeline sold gas across state lines. The result was a regulatory void on exactly the segment of the gas trade where monopoly pricing was easiest.
President Roosevelt signed the Natural Gas Act on Tues June 21, 1938 (Public Law 75-688). The act gave the Federal Power Commission, an existing agency that had been created in 1920 to regulate hydroelectric licensing on navigable waters, jurisdiction over three things: the rates charged on interstate sales of natural gas for resale, the construction of new interstate pipelines through certificates of public convenience and necessity, and the abandonment of any service once initiated. State utility commissions retained jurisdiction over local distribution and over intrastate transportation. The interstate-intrastate boundary defined under the 1938 act has been the central organizing line of US gas regulation ever since.
What the 1938 act did not do was regulate the wellhead. It applied to interstate pipelines and to the city-gate prices at which those pipelines sold to local distribution companies. The price the producer received from the pipeline at the wellhead was understood at the time to be a private commercial transaction outside the act’s reach. That understanding survived for sixteen years.
Phillips v. Wisconsin and the wellhead price-control era, 1954 to 1978
Phillips Petroleum Company was a Bartlesville, Oklahoma, producer that sold a substantial share of the natural gas produced from its Texas and Oklahoma fields to interstate pipelines for transport to the upper Midwest. The State of Wisconsin, acting through the Wisconsin Public Service Commission and joined by other consuming-state regulators, petitioned the Federal Power Commission in 1948 to extend its rate jurisdiction to Phillips’s wellhead sales on the theory that the pipeline city-gate rate was meaningless if the producer at the other end could charge whatever it liked. The FPC, after a lengthy administrative proceeding, declined. Wisconsin appealed. The case reached the Supreme Court in the 1953 term.
The Court’s opinion in Phillips Petroleum Co. v. Wisconsin, 347 U.S. 672, was issued on Mon June 7, 1954. Justice Sherman Minton wrote for the majority. The opinion held that an “independent” gas producer (one not affiliated with the pipeline buyer) selling gas in interstate commerce for resale was a “natural-gas company” within the meaning of the 1938 act, and that its wellhead sales were therefore subject to FPC rate jurisdiction. Three justices dissented; Justice Douglas wrote the principal dissent, on the ground that the act’s framers had explicitly considered and rejected the inclusion of wellhead sales.
The decision overwhelmed the agency. By the mid-1960s the FPC was carrying a docket of more than three thousand individual producer rate cases, on each of which it was supposed to determine a “just and reasonable” wellhead price. In 1960 the agency abandoned the case-by-case approach and shifted to “area rate-making,” setting a single ceiling price for each major producing region. The Permian Basin Area Rate Case, the central early test, was finally decided by the Supreme Court in Permian Basin Area Rate Cases, 390 U.S. 747 (1968). Area rates kept the system working but left ceilings well below the cleared price in unregulated markets.
The unregulated market existed inside the producing states. Texas, Louisiana, Oklahoma, and Kansas operated intrastate pipeline systems that carried gas from a Texas wellhead to a Texas refinery or chemical plant or power station entirely within the state, and those flows were not interstate commerce and were therefore outside FPC jurisdiction. By the early 1970s, intrastate gas in Texas was clearing at $1.50 to $2.00 per million British thermal units while interstate gas under FPC ceilings was capped at $0.30 to $0.50. Producers naturally preferred to sell intrastate. New gas dedicated to interstate pipelines slowed to a trickle. Reserves additions in the lower 48 turned negative in 1968 and stayed negative through most of the 1970s.
Two consecutive cold winters made the structural problem visible. In the winter of 1973 to 1974, the FPC ordered interstate pipelines to curtail deliveries to industrial customers in order to preserve supply for residential heating, the first peacetime federal gas curtailments in US history. In the winter of 1976 to 1977, much harder, schools closed in Cincinnati and Buffalo, plants shut from Cleveland to Pittsburgh, and President Carter signed the Emergency Natural Gas Act of 1977 on Wed February 2, 1977 (Public Law 95-2), the first federal statute that allowed the temporary purchase of intrastate gas at uncapped prices for emergency interstate delivery. Carter addressed the country in a fireside chat the same evening and asked Americans to lower their thermostats to 65 degrees during the day and 55 at night. The shortage that the price ceilings had been designed to prevent was the shortage they had produced.
The structural fix arrived twenty-one months later. The Natural Gas Policy Act of 1978, signed by Carter on Thurs November 9, 1978 as part of the National Energy Act package (Public Law 95-621), created a phased decontrol of wellhead prices. The statute split US gas production into roughly two dozen vintage and category codes distinguishing “old” gas (committed to interstate commerce before the act) from “new” gas (drilled after the act) and from gas produced from designated “tight formations” or other unconventional sources. Most categories of new gas were scheduled to decontrol on Tues January 1, 1985. Some categories of old gas would remain capped indefinitely. The 1978 act ended the structural shortage by promising producers a market price on new wells, but it left the old-and-new dual market intact for another decade. Final wellhead decontrol came with the Natural Gas Wellhead Decontrol Act of 1989, signed by President Bush on Wed July 26, 1989 (Public Law 101-60), which removed the remaining ceilings effective Fri January 1, 1993. The Phillips era ended thirty-eight years and seven months after it began.
Deregulation, 1978 to 1992
The wellhead was the upstream half of the regulatory frame. The pipeline was the other. Through the 1970s and into the early 1980s, an interstate pipeline operated as a vertically integrated merchant: it bought gas from producers under long-term contracts at the wellhead, transported the gas across its own line, and resold the gas at the city gate to local distribution companies. The pipeline took the commodity risk. To protect itself from a fall in city-gate prices, it wrote “take or pay” provisions into its producer contracts that obligated it to take a specified volume each year or to pay for it whether or not it took delivery.
When wellhead prices fell after 1985 in response to the post-1981 oil-price collapse and the recession in industrial gas demand, those take-or-pay obligations turned into balance-sheet bombs. By 1986 the interstate pipeline industry’s outstanding take-or-pay liabilities ran into roughly ten billion dollars, an order of magnitude beyond what any single pipeline could absorb. The pipeline-as-merchant business model was structurally insolvent.
FERC, which had succeeded the FPC under the Department of Energy Organization Act of 1977 effective Sat October 1, 1977, walked the industry through the unwinding in a series of orders. Order 380 in May 1984 freed local distribution customers from minimum-bill obligations to their pipelines. Order 436 in October 1985 created a voluntary “open access” framework under which a pipeline could elect to provide transportation-only service to third-party shippers, in exchange for streamlined rate treatment. Most pipelines accepted because the voluntary framework offered a path out of the take-or-pay trap. The DC Circuit struck down portions of Order 436 in Associated Gas Distributors v. FERC in 1987, and FERC reissued the framework as Order 500 in August 1987.
The decisive order came on Wed April 8, 1992. FERC Order 636 made open-access transportation mandatory and required interstate pipelines to fully unbundle their merchant gas service from their transportation service. After Order 636, an interstate pipeline could no longer sell gas to its customers; it was a common carrier that moved gas under tariff for whoever held capacity. The order also created the capacity-release mechanism, the secondary market by which a holder of firm transportation capacity could resell that capacity to a third party at a market-clearing price. The pipeline-as-merchant business model ended that day.
The merchant function did not disappear. It moved to a new class of intermediary, the gas marketer, often a former merchant arm of the pipeline now spun off as a separate subsidiary. Enron Capital and Trade Resources, Coastal States, Williams Energy Marketing, and Dynegy were among the largest. Through the 1990s these marketers built the trading desks, the credit infrastructure, and the financial instruments that turned the deregulated industry into a daily price-discovery market. Most of them either disappeared or shrank to a fraction of their 1990s scale in the wake of the Enron collapse in late 2001. The successor structure of producer marketing arms, large utility purchasing desks, and a handful of bank and merchant trading desks is the structure that runs today’s market.
The Henry Hub futures launch, April 3, 1990
The deregulating gas industry needed a forward curve. Local distribution companies and industrial buyers needed to lock in winter heating costs in summer. Producers needed to hedge new-well economics against a fluctuating Henry Hub. The hedging tool the industry had used through the 1980s was a survey-based monthly index, the Inside FERC Gas Market Report, published by McGraw-Hill, which polled buyers and sellers each month at fifty or so US pricing points and printed an “index of indexes” that was the de facto monthly settlement reference for physical gas contracts. The index moved monthly. The forward market was bilateral, opaque, and credit-constrained.
The New York Mercantile Exchange listed the Henry Hub Natural Gas futures contract on Tues April 3, 1990. The contract was 10,000 million British thermal units in size, with physical delivery at the Henry Hub junction in Erath, Vermilion Parish, Louisiana, operated at the time by Sabine Pipe Line LLC. The choice of Henry Hub was straightforward. The hub was the intersection of nine major interstate pipelines (Acadian, Columbia Gulf, Gulf South, Sea Robin, Southern Natural, Texas Eastern, Texas Gas Transmission, Transco, and Trunkline), which gave it physical liquidity and connectivity to most of the eastern US and Gulf demand basin. It sat in Louisiana, which gave it intrastate flexibility under both interstate and intrastate jurisdictions. The gas was easy to deliver and easy to price.
Open interest grew slowly through the first two years. After Order 636 in 1992, the futures contract became the financial backbone of the deregulated industry, and volumes grew fast through the rest of the decade. The Intercontinental Exchange, ICE, listed a competing OTC-cleared Henry Hub contract in 2002 after acquiring the International Petroleum Exchange the previous year. ICE’s Henry Hub contract has since become the larger of the two by some volume measures, and the daily settlement of the NYMEX contract is calculated against a defined trading window in which the ICE contract is also actively traded. The two contracts together set the US benchmark.
The pre-shale gas era, 1990 to 2005
Through the 1990s, US dry gas production was approximately flat at 18 to 19 trillion cubic feet per year, consumption was rising, and conventional reserves were depleting. The growth basins of the decade were the unconventional plays that the Section 29 federal tax credit, created by the Crude Oil Windfall Profit Tax Act of 1980 and applicable to gas wells drilled before 1993 and produced through 2002, had subsidized into commercial existence.
Coalbed methane became a real industry in the 1990s. The San Juan Basin’s Fruitland Coal in northwestern New Mexico and southwestern Colorado was the early commercial reference, with Burlington Resources, Amoco, and El Paso all running large CBM programs. The Powder River Basin in Wyoming and Montana opened in the late 1990s on shallower coals with lower gas content but very high well counts. Combined CBM production in the lower 48 grew from negligible in the late 1980s to roughly 1.7 trillion cubic feet per year by 2002. Tight gas plays followed similar logic. The Pinedale Anticline and Jonah Field in Sublette County, Wyoming, drilled by Ultra Petroleum, Questar, and Burlington Resources, scaled through the late 1990s and the 2000s.
The price cycle that ran from 2003 through 2008 was severe. Henry Hub annual average prices climbed from $5.47 per million British thermal units in 2003 to $5.89 in 2004, $8.69 in 2005 (Hurricane Katrina), $6.73 in 2006, $6.97 in 2007, and $8.86 in 2008, with daily prints above $13 in late 2005 and again in mid-2008. The industry consensus across the upstream, the midstream, and the EIA was that the United States was structurally short gas. The Annual Energy Outlook 2003 forecast that lower-48 production would decline through the next decade and that the supply gap would be filled by LNG imports.
The LNG-import infrastructure was built on that thesis. Cove Point in Maryland, mothballed since 1980, was reactivated as an importer in 2003. Sabine Pass commissioned its import terminal in 2008. Cameron LNG (Sempra) commissioned its import facility in 2009. Freeport LNG, Northeast Gateway, Gulf Gateway, and several others reached commercial operation in the same window. Total US LNG nameplate import capacity reached roughly 22 billion cubic feet per day by 2010. The combined capital cost of the import buildout was on the order of fifteen billion dollars. Most of it was stranded within five years.
The shale revolution, 2008 to 2016
Mitchell Energy and Development Corporation, founded by George Mitchell, drilled and refractured its first commercially economic horizontal-completion wells in the Barnett Shale of Wise County, Texas, in the late 1990s, after roughly fifteen years of experimentation with foam fracs, gel fracs, and finally the slickwater-frac design that became the industry standard. The first slickwater frac that produced economic returns at the wellhead is generally dated to 1998. Devon Energy acquired Mitchell on Mon August 5, 2002, in a transaction valued at approximately $3.5 billion in stock and assumed debt. Devon paired the Barnett completions with horizontal drilling and scaled the play.
Range Resources drilled the Renz #1 well in Mt. Pleasant Township, Washington County, Pennsylvania, with completion in October 2004. The well was drilled to roughly 7,800 feet vertical depth into the Marcellus Shale section. Range completed it as a vertical Marcellus producer using a Mitchell-style slickwater frac. The Renz #1 is generally credited as the first commercial Marcellus Shale well. Range followed with horizontal-completion Marcellus wells through 2007 and 2008.
The play scaled fast. The Haynesville Shale in northwest Louisiana and east Texas, drilled by Chesapeake Energy and Petrohawk, opened in 2008 and reached two billion cubic feet per day of production within eighteen months. The Marcellus opened across most of southwestern Pennsylvania, West Virginia, and into eastern Ohio in 2008 and 2009. The EIA’s published estimate of US dry natural gas proved reserves rose by more than 10 percent in a single reporting year between 2008 and 2009, the largest single-year increase the agency had ever recorded. The 2009 reserves report, published in late 2010, showed another double-digit increase.
The price effect was structural. Henry Hub annual average prices fell from $8.86 in 2008 to $3.94 in 2009, $4.37 in 2010, and $2.75 in 2012, with intraday prints below $1.85 in April 2012. The LNG import buildout was abandoned within thirty months of its peak. Cheniere Energy filed an application with FERC in 2010 to add four liquefaction trains at the Sabine Pass import terminal and reverse the flow. The Department of Energy granted Sabine Pass conditional non-FTA export authorization on Fri May 20, 2011, the first such authorization issued for the Lower 48. Cheniere reached final investment decision on Trains 1 and 2 in August 2012 and broke ground with Bechtel as the EPC contractor. The other operators of the import terminals built between 2003 and 2009 (Freeport, Cameron, Cove Point, Corpus Christi, Elba Island) filed similar conversion or new-build applications between 2010 and 2014.
The LNG export era, 2016 to present
The Asia Vision tanker loaded the first commercial LNG cargo from the Lower 48 at Sabine Pass on Wed February 24, 2016, bound for the Petrobras regasification terminal at Bahia, Brazil. Sabine Pass Train 1 had completed commissioning earlier that month. Train 2 followed in mid-2016. By the end of 2019, US LNG export capacity was around 6 billion cubic feet per day across five operating terminals (Sabine Pass, Cove Point, Cameron, Freeport, Elba Island). Corpus Christi had taken its first cargo in December 2018 and was ramping. Calcasieu Pass and Plaquemines, Venture Global’s mid-scale modular projects, would open in 2022 and 2024 respectively.
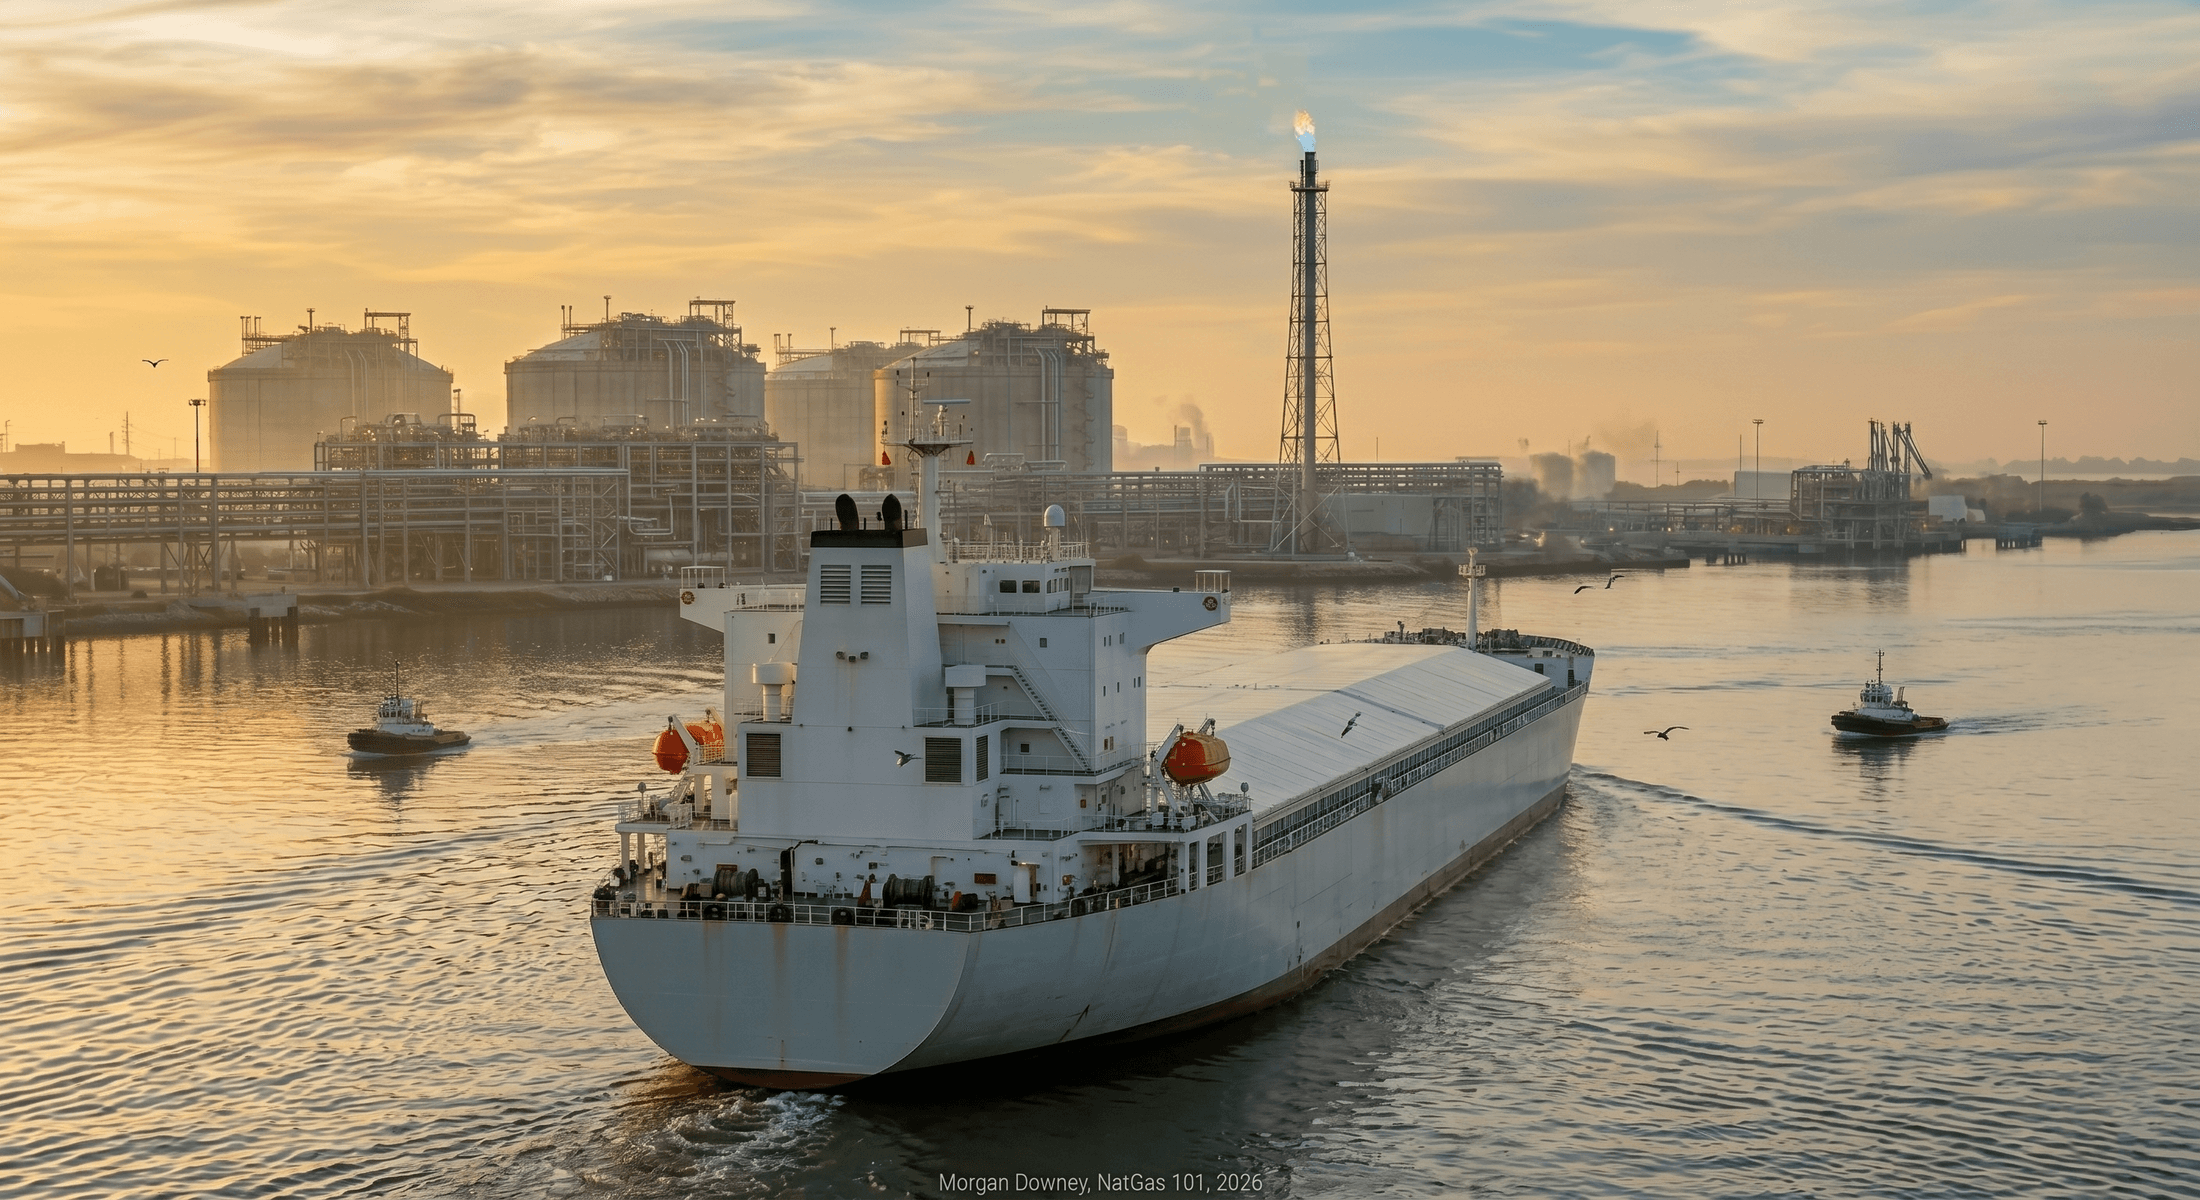
Total US LNG gross exports averaged approximately 11.9 billion cubic feet per day in 2024 and are running closer to 14 in 2025, against zero in 2015. The United States passed Australia and Qatar to become the largest LNG exporter in the world in 2023. Eight US LNG export terminals were in commercial service by the end of 2024.
The 2022 European supply shock accelerated everything. Russia cut pipeline gas deliveries to Europe in stages through the spring and summer of 2022, with the Nord Stream pipelines sabotaged on Mon September 26, 2022. TTF spot gas prices in the Netherlands, the European benchmark, traded above EUR 300 per megawatt-hour in late August 2022, the equivalent of roughly $90 per million British thermal units, several times the prevailing JKM Asian spot price and many times Henry Hub. US LNG cargoes redirected en masse from Asia to Europe; the European share of US LNG exports rose from approximately 35 percent in 2021 to roughly 70 percent in 2022.
What this changed about Henry Hub is structural. Henry Hub remains the US benchmark and remains the price-setting input for most US gas commerce. But the marginal molecule at the export dock is now sold at a TTF-linked or JKM-linked price into a European or Asian buyer that is competing for the same molecule with a Norwegian pipeline supplier or a Qatari long-term contract. The Henry Hub forward curve has integrated, with a lag and a basis, into the global LNG curve. Cold weather in northern Europe now bids up Henry Hub. A demand shock in northeast Asia now ripples back to the Permian wellhead. The fragmented continental market that the 1938 act, the Phillips decision, and Order 636 had each remade in succession is now a node in a global network.
Where the market sits today, 2025 to 2026
The production base is shale-dominant. Roughly 75 percent of US dry natural gas production now comes from three plays: the Marcellus and Utica in Appalachia, the Haynesville in northwest Louisiana, and the Permian Basin in West Texas, where gas is produced as a byproduct of crude oil drilling. Total US dry production is approximately 108 billion cubic feet per day in early 2026. Demand is approximately 90 billion cubic feet per day domestic, 14 LNG export, and 6 pipeline export to Mexico. Reserves have stopped being the constraint on the system; takeaway pipeline capacity is, particularly out of the Permian, where associated gas growth has chronically run ahead of new pipe. Matterhorn Express, in service since September 2024, eased the immediate squeeze. Two more Permian takeaway projects are scheduled for 2026.
The new structural demand source is data center power consumption, which is on a trajectory to add roughly 10 to 30 gigawatts of new gas-fired generation through 2030. The Strait of Hormuz crisis of April 2026, covered in Oil 101 Chapter 26, has shifted the global LNG balance in ways that the United States is structurally positioned to absorb. The molecule that Hart lit in Fredonia in 1821 is now a global commodity moved by 700 ships, hedged on two continents, and watched daily by the entire energy market.
Carter’s Cardigan, February 2, 1977
A brief aside on the night the President of the United States went on national television in a sweater.

On Wed February 2, 1977, in the middle of the worst peacetime natural gas shortage in American history, President Jimmy Carter signed the Emergency Natural Gas Act of 1977 in a morning Oval Office ceremony, then sat down that evening in front of a fire in the White House Library to give the first televised “fireside chat” of his presidency. He wore a beige cardigan sweater and asked Americans to lower their thermostats to 65 degrees during the day and 55 degrees at night to ride out the shortage.
Schools were closed in Cincinnati that week. Industrial gas customers in Ohio, Pennsylvania, and the Midwest had been curtailed by the FPC. Plants were idled from the Cleveland steel mills to the Erie chemical complex. The Texas intrastate market a thousand miles away had plenty of gas; it was clearing at three times the FPC interstate ceiling and producers had no incentive to send a single molecule north. The Phillips decision was twenty-two years old. The price ceiling had stopped exploration, the cold winter had run down storage, and the country that had invented the natural gas industry was sitting in the dark in cardigans because the regulatory architecture would not let the market clear.
The cardigan became a national punchline. The shortage produced a piece of legislation that finally fixed the problem: the Natural Gas Policy Act, signed twenty-one months later. The lesson the industry remembers is the structural one. A captive market cannot wait. When the pipes are full and the wellhead is capped, the customer freezes.
The market the Phillips decision built was a market of pipelines, wellhead ceilings, and statutory categories. The market that Order 636 and the shale revolution rebuilt is a market of producers, marketers, FERC-regulated common carriers, futures-cleared price discovery, and an LNG export complex now plugged into the global gas trade. The next chapter introduces the people and the firms that move the molecule through that market, from the wellhead to the burner tip.